Profile Data Management
ParaProf uses PerfDMF to manage profile data. This enables it to read the various profile formats as well as store and retrieve them from a database.
ParaProf Manager Window
Upon launching ParaProf, the user is greeted with the ParaProf Manager Window.
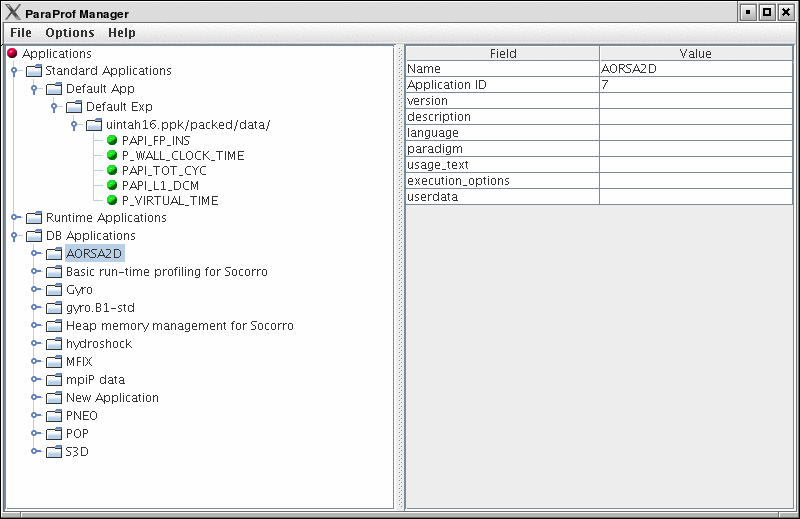
This window is used to manage profile data. The user can upload/download profile data, edit meta-data, launch visual displays, export data, derive new metrics, etc.
Loading Profiles
To load profile data, select File→Open, or right click on the Application’s tree and select "Add Trial".
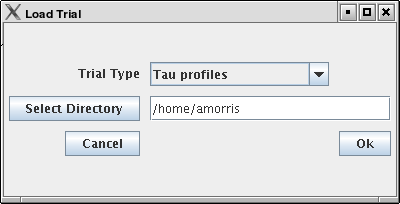
Select the type of data from the "Trial Type" drop-down box. For TAU Profiles, select a directory, for other types, files.
Database Interaction
Database interaction is done through the tree view of the ParaProf Manager Window. Applications expand to Experiments, Experiments to Trials, and Trials are loaded directly into ParaProf just as if they were read off disk. Additionally, the meta-data associated with each element is show on the right, as in ParaProf Manager Window . A trial can be exported by right clicking on it and selecting "Export as Packed Profile".
New trials can be uploaded to the database by either right-clicking on an entity in the database and selecting "Add Trial", or by right-clicking on an Application/Experiment/Trial hierarchy from the "Standard Applications" and selecting "Upload Application/Experiment/Trial to DB".
Creating Derived Metrics
ParaProf can created derived metrics using the Derived Metric Panel , available from the Options menu of the ParaProf Manager Window.
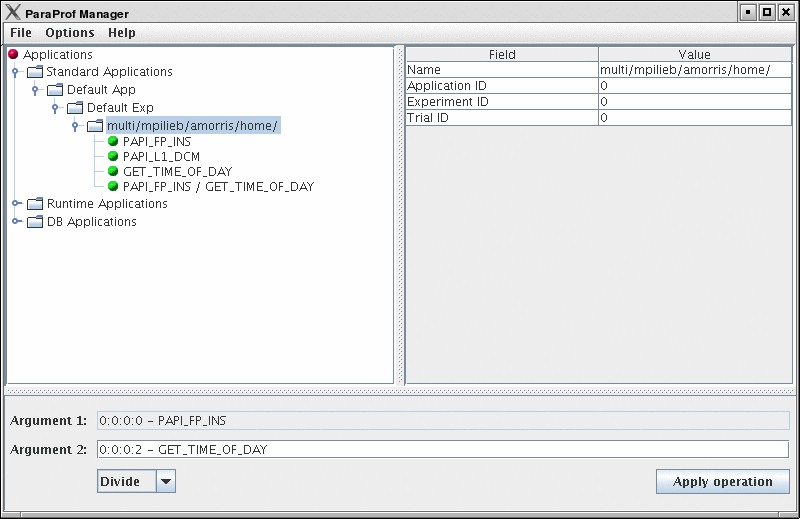
In Creating Derived Metrics , we have just divided Floating Point Instructions by Wall-clock time, creating FLOPS (Floating Point Operations per Second). The 2nd argument is a user editable text-box and can be filled in with scalar values by using the keyword 'val' (e.g. "val 1.5").
Main Data Window
Upon loading a profile, or double-clicking on a metric, the Main Data Window will be displayed.
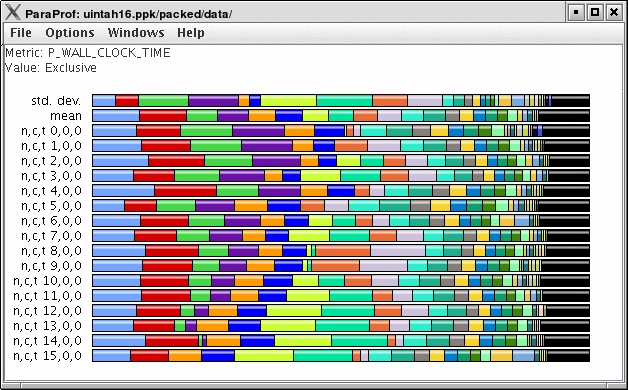
This window shows each thread as well as statistics as a combined bar graph. Each function is represented by a different color (though possibly cycled). From anywhere in ParaProf, you can right-click on objects representing threads or functions to launch displays associated with those objects. For example, in Main Data Window , right click on the text n,c,t, 8,0,0 to launch thread based displays for node 8.

You may also turn off the stacking of bars so that individual functions can be compared across threads in a global display.