Correlation Analysis
Correlation analysis in PerfExplorer is used to explore relationships between events in a profile. Each event is pairwise plotted with the other events, and a correlation coefficient is calcuated for the relationship. When the events are highly positively correlated (coefficient of close to 1.0) or highly negatively correlated (coefficient close to -1.0), then the relationships will show up as linear groupings in the results. Clusters may also be apparent.
Dimension Reduction
Often, many hundreds of events are instrumented when profile data is collected. Clustering works best with dimensions less than 10, so dimension reduction is often necessary to get meaningful results. Currently, there is only one type of dimension reduction available in PerfExplorer. To reduce dimensions, the user specifies a minimum exclusive percentage for an event to be considered "significant".
To reduce dimensions, select the "Select Dimension Reduction" item under the "Analysis" main menu bar item. The following dialog will appear:
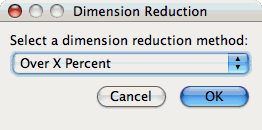
Select "Over X Percent". The following dialog will appear:
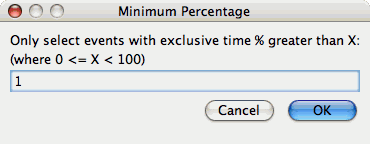
Enter a value, for example "1".
Performing Correlation Analysis
To perform correlation analysis, you first need to select a metric. To select a metric, navigate through the tree of applications, experiments and trials, and expand the trial of interest, showing the available metrics, as shown in the figure below:
	Metric to Cluster
image::clusteringselection.png[Selecting a
	Metric to Cluster,width="6in",align="center"]
After selecting the metric of interest, select the "Do Correlation Analysis" item under the "Analysis" main menu bar item. A confirmation dialog will appear, and you can either confirm the correlation request or cancel it. After confirming the correlation, the analysis will begin. When the analysis results are available, you can view them in the "Correlation Results" tab.
	Results
image::correlationresults.png[Correlation
	Results,width="6in",align="center"]
There are a number of images in the "Correlation Results" window. Each thumbnail represents a pairwise correlation plot of two events. Clicking on a thumbnail image in the main window will bring up the images, as shown below:
	Example
image::correlationexample.png[Correlation
	Example,width="6in",align="center"]