Thread Based Displays
ParaProf displays several windows that show data for one thread of execution. In addition to per thread values, the users may also select mean or standard deviation as the "thread" to display. In this mode, the mean or standard deviation of the values across the threads will be used as the value.
Thread Bar Graph

This display graphs each function on a particular thread for comparison. The metric, units, and sort order can be changed from the Options menu.
Thread Statistics Text Window
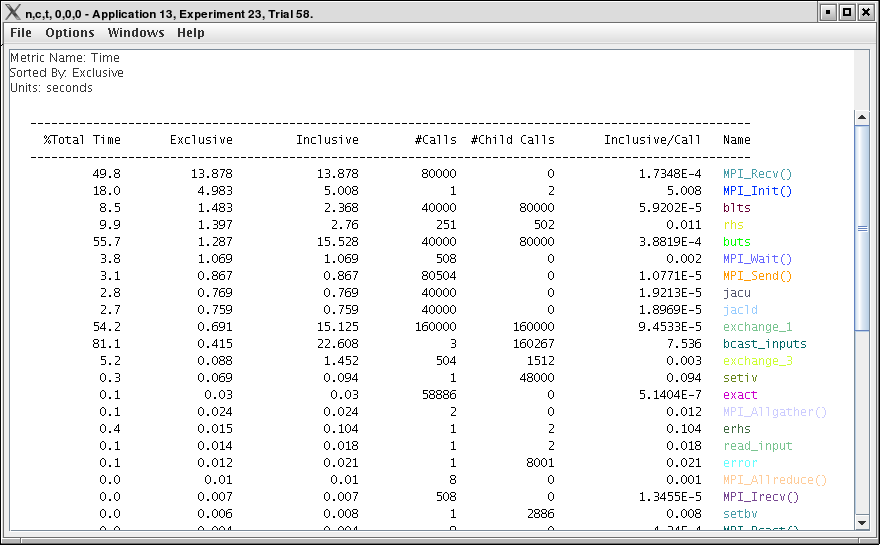
This display shows a pprof style text view of the data.
Thread Statistics Table
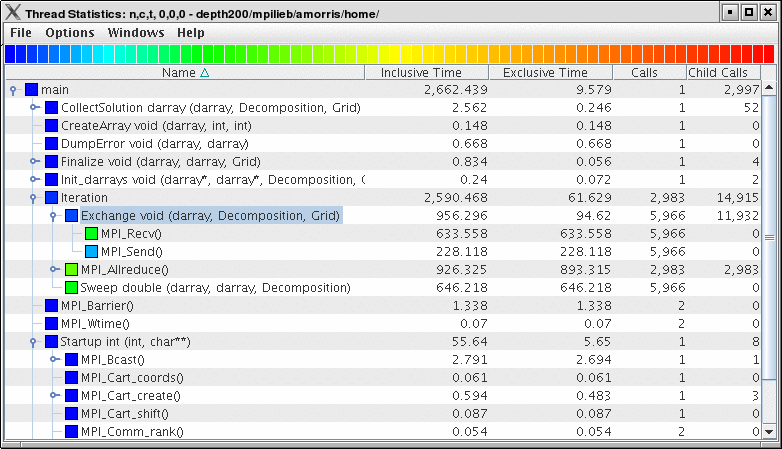
This display shows the callpath data in a table. Each callpath can be traced from root to leaf by opening each node in the tree view. A colorscale immediately draws attention to "hot spots", areas that contain highest values.


The display can be used in one of two ways, in "inclusive/exclusive" mode, both the inclusive and exclusive values are shown for each path, see Thread Statistics Table, inclusive and exclusive for an example.
When this option is off, the inclusive value for a node is show when it is closed, and the exclusive value is shown when it is open. This allows the user to more easily see where the time is spent since the total time for the application will always be represented in one column. See Thread Statistics Table and Thread Statistics Table for examples. This display also functions as a regular statistics table without callpath data. The data can be sorted by columns by clicking on the column heading. When multiple metrics are available, you can add and remove columns for the display using the menu.
Call Graph Window
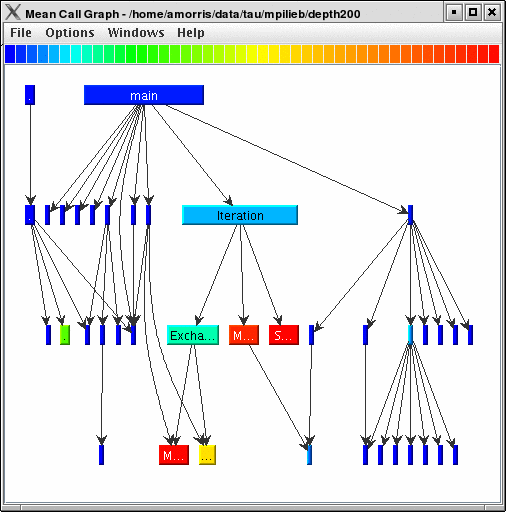
This display shows callpath data in a graph using two metrics, one determines the width, the other the color. The full name of the function as well as the two values (color and width) are displayed in a tooltip when hovering over a box. By clicking on a box, the actual ancestors and descendants for that function and their paths (arrows) will be highlighted with blue. This allows you to see which functions are called by which other functions since the interplay of multiple paths may obscure it.
Thread Call Path Relations Window

This display shows callpath data in a gprof style view. Each function is shown with its immediate parents. For example, Thread Call Path Relations Window shows that MPI_Recv() is call from two places for a total of 9.052 seconds. Most of that time comes from the 30 calls when MPI_Recv() is called by MPIScheduler::postMPIRecvs() . The other 60 calls do not amount to much time.
User Event Statistics Window

This display shows a pprof style text view of the user event data. Right clicking on a User Event will give you the option to open a Bar Graph for that particular User Event across all threads. See [paraprof.userevent.bargraph]
User Event Thread Bar Chart

This display shows a particular thread’s user defined event statistics as a bar chart. This is the same data from the User Event Statistics Window , in graphical form.