TAU Reference Guide
1. Installation
TAU (Tuning and Analysis Utilities) is a portable profiling and tracing toolkit for performance analysis of parallel programs written in Fortran, C, C, Java and Python. The model that TAU uses to profile parallel, multi-threaded programs maintains performance data for each thread, context, and node in use by an application. The profiling instrumentation needed to implement the model captures data for functions, methods, basic blocks, and statement execution at these levels. All C language features are supported in the TAU profiling instrumentation including templates and namespaces, which is available through an API at the library or application level. The API also provides selection of profiling groups for organizing and controlling instrumentation. The instrumentation can be inserted in the source code using an automatic instrumentor tool based on the Program Database Toolkit (PDT), dynamically using DyninstAPI, at runtime in the Java virtual machine, or manually using the instrumentation API. TAU’s profile visualization tool, paraprof, provides graphical displays of all the performance analysis results, in aggregate and single node/context/thread forms. The user can quickly identify sources of performance bottlenecks in the application using the graphical interface. In addition, TAU can generate event traces that can be displayed with the Vampir or Paraver trace visualization tools. This chapter discusses installation of the TAU portable profiling package.
Some tau options allow external resources to be automatically downloaded and built when TAU is configured. To obtain these resources in a single package download http://tau.uoregon.edu/ext.tgz and unpack it in TAU’s root directory. When you configure TAU with:
-
-bfd=download -
-unwind=download -
-ompt=download
these packages will be provided by the ext.tgz package and no additional network activity will be required.
1.1. Installing TAU
1.1.1. Know what options you will need
Each TAU configuration results in a single Makefile . These Makefiles denote the configuration that produced it and is used by the user to select the TAU libraries/scripts associated with its configuration. (These makefiles are named after the configuration options, ie. TAU configured with MPI, PDT, PGI compilers and the '-nocomm' option is named: Makefile.tau-nocomm-mpi-pdt-pgi ). On most machines several configuration of TAU will need to be built in order to take full advantage of the many features of TAU. This section should help you decide on the smallest set of configuration you will need to build.
The options used to configure TAU can be grouped into two categories:
-
External packages: TAU will use these when instrumenting or measuring an application. Configuring with these options does not force the user to use these packages , ie: configuring with PDT does not force the user to use source code based instrumentation (they can use compiler based instrumentation instead). Similarly configuring with PAPI does not forces the user to select any PAPI counters when profiling.
|
The only exception is configuring with the epilog (scalasca) tracing package. This will replace the TAU tracer with the epliog one, a single configuration cannot use both tracers. |
+ For this reason it is recommend that you configure with every external packages that the user might be interested in using , letting them choose which packages to enable when they go to instrument or measure their application.
-
Compiler and MPI options: these control the behavior of TAU when it compiles the instrumented application. TAU provides compiler wrapper scripts, these options control which compiler TAU will wrap, These options are determinative: select only options that are compatible. For example, when configuring with MPI use a version of MPI compatible with the compiler you select.
Since multiple compiler/MPI libraries cannot be specified for a single configuration, each set of compiler/MPI libraries that you want to use with TAU need to be configured separately.
Configurations with different compilers are given separate
Makefilesautomatically, however configurations with different MPI implementations are not. Use the-tag=option to distinguish between different MPIs, ie:-tag=mvapichor-tag=openmpi.
The configure shell script attempts to guess correct values for various system-dependent variables used during compilation (compilers and system architecture), other options need to be specified on the command line.
The following are the most important command-line options are available to configure:
1.1.2. Common configuration options
Select compiler
TAU defaults to using any compilers found in the environment. To use a specific compiler use these options:
-
-c=<C compiler>Specifies the name of the C compiler. Supported C compilers include KCC (from KAI/Intel), CC (SGI, Sun), g (from GNU), FCC (from Fujitsu), xlC (from IBM), guidec (from KAI/Intel), cxx (Tru64) and aCC (from HP), c++ (from Apple), icpc and ecpc (from Intel) and pgCC (from PGI).
-
-cc=<C Compiler>Specifies the name of the C compiler. Supported C compilers include cc, gcc (from GNU), pgcc (from PGI), fcc (from Fujitsu), xlc (from IBM), and KCC (from KAI/ Intel), icc and ecc (from Intel).
-
-fortran=<Fortran Compiler>Specifies the name of the Fortran90 compiler. Valid options are: gnu, sgi, ibm, ibm64, intel, cray, pgi, absoft, fujitsu, sun, kai, nec, hitachi, compaq, nagware, g95 and hp.
Using MPI
To profile a program that use MPI configure TAU with these options:
-
-mpiWith this option, TAU will try to guess the location of the MPI libraries if the mpirun command is in your path. This does not always work in which case use these more detailed options:
-
-mpiinc=<directory>Specifies the directory where MPI header files reside (such as mpi.h and mpif.h). This option also generates the TAU MPI wrapper library that instruments MPI routines using the MPI Profiling Interface. See the examples/NPB2.3/config/make.def file for its usage with Fortran and MPI programs. MPI
-
-mpilib=<directory>Specifies the directory where MPI library files reside. This option should be used in conjunction with the -mpiinc=<directory> option to generate the TAU MPI wrapper library.
-
-mpilibrary=<lib>Specifies the use of a different MPI library. By default, TAU uses -lmpi or -lmpich as the MPI library. This option allows the user to specify another library. e.g., -mpilibrary=-lmpi_r for specifying a thread-safe MPI library.
-
-mpitActivates MPI-T support in TAU. Use in conjunction with an MPI implementation that supports MPI-T such as MVAPICH or MPICH. To enable collection of PVARS, set TAU_TRACK_MPI_T_PVARS environment variable to 1. To set CVARs, use the two environment variables below in the following fashion:
bash$export TAU_MPI_T_CVAR_METRICS=MPIR_CVAR_VBUF_POOL_CONTROL,MPIR_CVAR_VBUF_POOL_REDUCED_VALUE[1]bash$export TAU_MPI_T_CVAR_VALUES=1,1Note that the METRICS should match exactly with the corresponding VALUES, and the name for the CVAR should be exactly as presented in TAU profiles. Once the above variables are set, use this feature as follows:
mpirun -np 4 tau_exec -T mpi,mpit ./a.out
OpenMP
To profile programs using openmp use -openm and either OPARI option:
-
-openmpSpecifies OpenMP as the threads package to be used. Open MPI
-
-opariThe use of Opari2 source-to-source instrumentor in conjunction with TAU exposes OpenMP events for instrumentation. See examples/opari directory. OPARI
-
-opari1Use this option for the use of the original Opari. Only use this option if -opari fails. OPARI
1.1.3. Configuring with external packages
-
-pdt=<directory>Specifies the location of the installed PDT (Program Database Toolkit) root directory. PDT is used to build tau_instrumentor, a C++, C and F90 instrumentation program that automatically inserts TAU annotations in the source code PDT . If PDT is configured with a subdirectory option (-compdir=<opt>) then TAU can be configured with the same option.
-
-pdt_c=<C Compiler>Specifies a different C compiler for PDT (tau_instrumentor). This is typically used when the library is compiled with a C compiler (specified with -c) and the tau_instrumentor is compiled with a different <pdt_c> compiler. For e.g.,
-arch=craycnl -pdt=/usr/pdtoolkit-3.17 -pdt_c++=g++ ...
uses g++ to compile the tau_instrumentor, for example on CRAY XT5 systems use this option to build TAU any of the backend compilers.
-arch=bgp -pdt=/usr/pdtoolkit-3.17 -pdt_c++=xlC -mpi
uses PDT, MPI for IBM BG/P and specifies the use of the front-end xlC compiler for building tau_instrumentor.
-
-papi=<directory>Specifies the location of the installed PAPI (Performance Data Standard and API) root directory. PCL provides a common interface to access hardware performance counters and timers on modern microprocessors. Most modern CPUs provide on-chip hardware performance counters that can record several events such as the number of instructions issued, floating point operations performed, the number of primary and secondary data and instruction cache misses. To measure floating point instructions, set the environment variable TAU_METRICS to PAPI_FP_INS (for example). This option (by default) specifies the use of hardware performance counters for profiling (instead of time). PAPI
-
-rocmSpecifies configuration with support for AMD ROCm profiling. This option can also be submitted with a directory (-rocm=<directory>) if ROCm is installed somewhere other than the default location of /opt/rocm. When TAU is configured with this option tau_exec can be run with -rocm to automatically capture events and metadata from the ROCm profiling API. ROCm
-
-rocprofiler=<directory>Specifies configuration with support for AMD ROCProfiler data collection. Must be used in conjuction with the -rocm option. Not compatible with the -roctracer option.
-
-roctracer=<directory>Specifies configuration with support for AMD ROCTracer data collection. Must be used in conjuction with the -rocm option. Not compatible with the -rocprofiler option.
-
-rocprofsdkIn conjunction with -rocm provides the functionality of both rocprofile and roctracer, plus rocm pc sampling with the -rocm_pc option for tau_exec. Requires ROCm 6.2 or greater.
-
-elfutils=<directory>or-elfutils=<download>In conjunction with -rocprofsdk provides the functionality of rocm pc sampling with the -rocm_pc option for tau_exec. Requires ROCm 6.2 or greater.
-
-level_zeroSpecifies configuration with support for Intel OneAPI’s Level Zero. This option can also be submitted with a directory (-level_zero=<directory>). Use in conjunction with the -opencl configuration option as needed. Level Zero
-
-sycl=<directory>Specify the directory where the sycl headers are located. Needed to configure TAU with ZeroSum and SYCL support.
-
-force_new_l0Use the most up to date Level Zero profiler. This is typically the default. Overrides detection logic.
-
-force_legacy_l0Use the legacy Level Zero profiler. The need for this is typically auto-detected. Overrides detection logic.
-
-epilog=<directory>Specifies the directory where the EPILOG tracing package EPILOG is installed.This option should be used in conjunction with the -TRACE option to generate binary EPILOG traces (instead of binary TAU traces). EPILOG traces can then be used with other tools such as EXPERT. EPILOG comes with its own implementation of the MPI wrapper library and the POMP library used with Opari. Using option overrides TAU’s libraries for MPI, and OpenMP.
-
-otf=<directory>Specifies the location of the OTF trace libraries generation package. TAU’s binary traces can be converted to the OTF format using tau2otf, a tool that links with the OTF library. Set
TAU_TRACE_FORMAT=otf2to generate OTF traces, viewable in vampirtrace, instead of TAU’s default trace format. -
-perfettoCauses TAU to build with Perfetto trace output support. Set
TAU_TRACE_FORMAT=perfettoto generate Perfetto traces, viewable in the online Perfetto trace viewer, instead of TAU’s default trace format. -
-vtf=<directory>Specifies the location of the VTF3 trace generation package. TAU’s binary traces can be converted to the VTF3 format using tau2vtf, a tool that links with the VTF3 library. The VTF3 format is read by Intel trace analyzer, formerly known as vampir, a commercial trace visualization tool developed by TU. Dresden, Germany.
1.1.4. More configuration options
-
-PROFILEPHASEThis option generates phase based profiles. It requires special instrumentation to mark phases in an application (I/O, computation, etc.). Phases can be static or dynamic (different phases for each loop iteration, for instance). See examples/phase/README for further information.
-
-prefix=<directory>Specifies the destination directory where the header, library and binary files are copied. By default, these are copied to subdirectories <arch>/bin and <arch>/lib in the TAU root directory.
-
-arch=<architecture>Specifies the architecture. If the user does not specify this option, configure determines the architecture. For IBM BGL, the user should specify bgl as the architecture. For SGI, the user can specify either of sgi32, sgin32 or sgi64 for 32, n32 or 64 bit compilation modes respectively. The files are installed in the <architecture>/bin and <architecture>/lib directories. Cray options are xt3, craycnl or crayxmt.
-
-tag=<Unique Name>Specifies a tag in the name of the stub Makefile and TAU makefiles to uniquely identify the installation. This is useful when more than one MPI library may be used with different versions of compilers. e.g.,
% configure -c++=icpc -cc=icc -tag=intel71-vmi \ -mpiinc=/vmi2/mpich/include -
-scalasca=<directory>Specifies the directory where the SCALASCA package is installed.
-
-pthreadSpecifies pthread as the thread package to be used. In the default mode, no thread package is used.
-
-ittnotifyBuild the Intel ITTNotify collector.
-
-opari_regionReport performance data for only OpenMP regions and not constructs. By default, both regions and constructs are profiled with Opari.
-
-opari_constructReport performance data for only OpenMP constructs and not Regions. By default, both regions and constructs are profiled with Opari.
-
-pdtarch=<architecture>Specifies the architecture used to build pdt, default the TAU architecture.
-
-papithreadsSame as papi, except uses threads to highlight how hardware performance counters may be used in a multi-threaded application. When it is used with PAPI, TAU should be configured with -papi=<directory> -pthread autoinstrument Shows the use of Program Database Toolkit (PDT) for automating the insertion of TAU macros in the source code. It requires configuring TAU with the -pdt=<directory> option. The Makefile is modified to illustrate the use of a source to source translator (tau_instrumentor).
-
-jdk=<directory>Specifies the location of the installed Java root directory. TAU can profile or trace Java applications without any modifications to the source code, byte-code or the Java virtual machine. See README.JAVA on instructions on using TAU with Java 2 applications. Also the refence guide has more information on the new tau_java tool. This option should only be used for configuring TAU to use JVMTI for profiling and tracing of Java applications. It should not be used for configuring paraprof, which uses Java from the user’s path.
-
-apexSpecifies support for the APEX framework. Requires
-pthreador-openmp -ompt=downloadto provide the communication layer. When running an application instrumented with APEX set the runtime environment variable APEX_SCREEN_OUTPUT to 1 to see APEX output. Set the runtime environment variable APEX_TAU to 1 to generate TAU profiles as well. See<tau2>/examples/apex/READMEfor more information. -
-sos=<directory>or-sos=<download>Specify location of an existing SOS_flow or download and configure a new install automatically.
-
-soscomm=<option>When building SOS_flow with -sos=download specifies the communication system to use. The options are
sockets, mpi, or evpath. The default is mpi. -
-beacon=<directory>Build TAU with BEACON support. BEACON allows remote monitoring of performance events and control of program behavior through interfaces such as MPI_T.
-
-dyninst=<directory>or-dyninst=<download>Specifies the directory where the DynInst dynamic instrumentation package is installed, or instructs TAU to download and configure a new install automatically. Using DynInst, a user can invoke tau_run to instrument an executable program at runtime or prior to execution by rewriting it. DyninstAPI PARA-DYN .
-
-vampirtrace=<directory>Specifies the location of the Vampir Trace package. With this option TAU will generate traces in Open Trace Format (OTF). For more information, see link: Technische Universitat Dresden
-
-scorep=<directory>or-scorep=<download>Specify location of an existing Score-P package or download and configure a new install automatically. Set the enviroment varible SCOREP_PROFILING_FORMAT to TAU_SNAPHOT so that Score-P will output TAU Snapsot profiles.
-
-shmeminc=<directory>Specifies the directory where shmem.h resides and specifies the use of the TAU SHMEM interface.
-
-shmemlib=<directory>Specifies the directory where libsma.a resides and specifies the use of the TAU SHMEM interface.
-
-shmemlibrary=<lib>By default, TAU uses -lsma as the shmem/pshmem library. This option allows the user to specify a different shmem library.
-
-ittnotifyEnables the -ittnotify option for tau_exec. This allows TAU to capture timers instrumented with Intels ITTNotify library. See examples/ittnotify and examples/pytorch/ittnotify.
-
-nocommAllows the user to turn off tracking of messages (synchronous/asynchronous) in TAU’s MPI wrapper interposition library. Entry and exit events for MPI routines are still tracked. Affects both profiling and tracing.
-
-cuda=<directory>Specifies the location of the top level CUDA SDK
-
-gpi=<directory>Specify use of TAU’s GPI wrapper library.
It works well with PDT and compiler based instrumentation of the source code and there is a wrapper interposition library that is linked in to track the communication of GPI. It is important to specify all TAU runtime options in the tau.conf file that must reside in the current working directory where the executable is stored and launched from. This is important because the worker tasks are spawned by the GPI daemon on remote nodes and do not inherit the user’s working directory or the environment. So, options such as TAU_TRACE=1, and sampling must be specified in the tau.conf file.
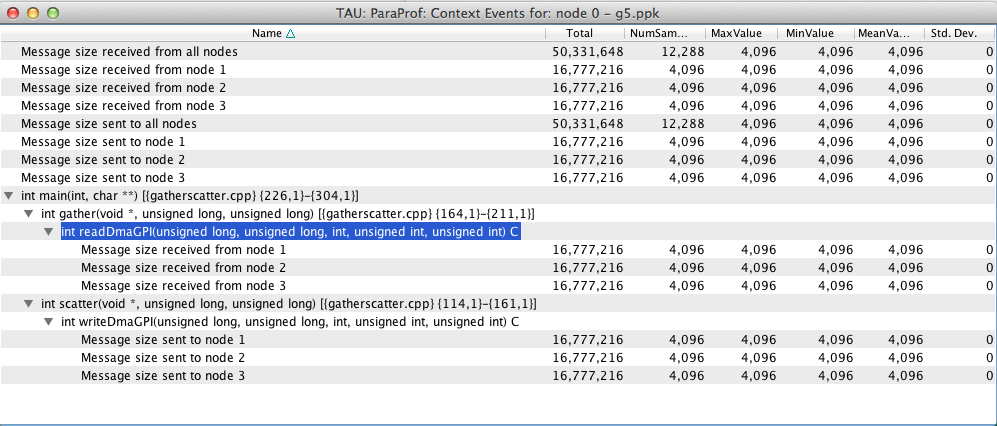 Figure 1. One sided communnication.
 -
-opencl=<directory>Specifies the location of the OpenCL package
-
-armci=<directory>Specifies the location of the ARMCI directory
-
-epiloglib=<directory>Specifies the directory of where the Epilog library is to be found. Ex: if directory structure is:
/usr/local/epilog/fe/lib/let the install options be:-epilog=/usr/local/epilog -epiloglib=/usr/local/epilog/fe/lib. -
-epilogbin=<directory>Specifies the directory of where the Epilog binaries are to be found.
-
-epiloginc=<directory>Specifies the directory of where the epilog’s included sources headers are to be found.
-
-MPITRACESpecifies the tracing option and generates event traces for MPI calls and routines that are ancestors of MPI calls in the callstack. This option is useful for generating traces that are converted to the EPILOG trace format. KOJAK’s Expert automatic diagnosis tool needs traces with events that call MPI routines. Do not use this option with the -TRACE option.
-
-python[3][=<directory>]Configure TAU with Python instrumentation support based on the python[3] detected in the environment. Alternatively provide a path to the location of a python interpreter to configure TAU to use that install of Python.
-
-pythoninc=<directory>Specifies the location of the Python include directory. This is the directory where Python.h header file is located. This option enables python bindings to be generated. The user should set the environment variable PYTHONPATH to <TAUROOT>/<ARCH>/lib/bindings-<options> to use a specific version of the TAU Python bindings. By importing package pytau, a user can manually instrument the source code and use the TAU API. On the other hand, by importing tau and using tau.run(`<func>'), TAU can automatically generate instrumentation. See examples/python directory for further information.
-
-pythonlib=<directory>Specifies the location of the Python lib directory. This is the directory where *.py and *.pyc files (and config directory) are located. This option is mandatory for IBM when Python bindings are used. For other systems, this option may not be specified (but -pythoninc=<directory> needs to be specified).
-
-PROFILEMEMORYSpecifies tracking heap memory utilization for each instrumented function. When any function entry takes place, a sample of the heap memory used is taken. This data is stored as user-defined event data in profiles/traces.
-
-PROFILECOMMUNICATORSThis option generates MPI information partitioned by communicators. TAU lists upto 8 ranks in each communicator in the listing.
-
-PROFILEHEADROOMSpecifies tracking memory available in the heap (as opposed to memory utilization tracking in -PROFILEMEMORY). When any function entry takes place, a sample of the memory available (headroom to grow) is taken. This data is stored as user-defined event data in profiles/traces. Please refer to the examples/headroom/README file for a full explanation of these headroom options and the C++/C/F90 API for evaluating the headroom.
-
-COMPENSATESpecifies online compensation of performance perturbation. When this option is used, TAU computes its overhead and subtracts it from the profiles. It can be only used when profiling is chosen. This option works with MULTIPLECOUNTERS as well, but while it is relevant for removing perturbation with wallclock time, it cannot accurately account for perturbation with hardware performance counts (e.g., L1 Data cache misses). See TAU Publication [Europar04] for further information on this option.
-
-PROFILECOUNTERSSpecifies use of hardware performance counters for profiling under IRIX using the SGI R10000 perfex counter access interface. The use of this option is deprecated in favor of the -pcl=<directory> and -papi=<directory> options described above.
-
-noexSpecifies that no exceptions be used while compiling the library. This is relevant for C++.
-
-useropt=<options-list>Specifies additional user options such as -g or -I. For multiple options, the options list should be enclosed in a single quote. For example
%./configure -useropt='-g -I/usr/local/stl'
-
-mrnet=<mrnet source root>Base location of the MRnet package.
-
-mrnetlib=<mrnet libraries>Path to the MRnet libraries.On some cluster systems the MRnet libraries need to available to the runtime system (ie. on the lustre filesystem.)
-
-scorep=<scorep subsystem>Path to the Score-P measurement system. Set the enviroment varible SCOREP_PROFILING_FORMAT to TAU_SNAPHOT so that Score-P will output TAU Snapsot profiles.
-
-helpLists available configure options and quits.
-
-fullhelpLists all available configure options, including obscure or deprecated ones, and quits.
1.1.5. tau_setup
tau_setup is a GUI interface to the configure and installtau tools.
1.1.6. installtau script
To install multiple (typical) configurations of TAU at a site, you may use the script `installtau'. It takes options similar to those described above. It invokes ./configure <opts>; make clean install; to create multiple libraries that may be requested by the users at a site. The installtau script accepts the following options:
% installtau -help

TAU Configuration Utility
***************************************************
Usage: installtau [OPTIONS]
  where [OPTIONS] are:
-arch=<arch>
-fortran=<compiler>
-cc=<compiler>
-c++=<compiler>
-useropt=<options>
-pdt=<pdtdir>
-pdtcompdir=<compdir>
-pdt_c++=<C++ Compiler>
-papi=<papidir>
-vtf=<vtfdir>
-otf=<otfdir>
-dyninst=<dyninstdir>
-mpi
-mpiinc=<mpiincdir>
-mpilib=<mpilibdir>
-mpilibrary=<mpilibrary>
-perfinc=<directory>
-perflib=<directory>
-perflibrary=<library>
-mpi
-tag=<unique name>
-opari=<oparidir>
-epilog=<epilogdir>
-epiloginc=<absolute path to epilog include dir> (<epilog>/include default)
-epilogbin=<absolute path to epilog bin dir> (<epilog>/bin default)
-epiloglib=<absolute path to epilog lib dir> (<epilog>/lib default)
-prefix=<directory>
-exec-prefix=<directory>
-j=<num processes for parallel make>  (just -j for full parallel)

******************************************************************
These options are similar to the options used by the configure script.
1.1.7. upgradetau
This script is provided to rebuild all TAU configurations previously built in a different TAU source directory. Give this command the location of a previous version of tau followed by any additional configurations and it will rebuild tau with these same options.
1.1.8. tau_validate
This script will attempt to validate a tau installation. Its only argument is TAU’s architecture directory. These are some options:
-
-v Verbose output
-
--html Output results in HTML
-
--build Only build
-
--run Only run
Here is a simple example:
bash : ./tau_validate --html x86_64 &> results.html
tcsh : ./tau_validate --html x86_64 >& results.html
1.2. Platforms Supported
TAU has been tested on the following platforms:
-
LINUX Clusters
On Linux based Intel x86 (32 and 64 bit) PC clusters, KAI/Intel’s KCC, g++, egcs (GNU), pgCC (PGI) , FCC (Fujitsu) and icpc/ecpc Intel compilers have been tested. TAU also runs under IA-64, Opteron, ARM, PowerPC, Alpha, Apple PowerMac, Sparc and other processors running Linux.
-
Cray Compute Node Linux (XT5, XT6, XE6), X1, T3E, SV-1, XT3, and RedStorm
When using Cray CNL you need to configure tau with the option
-arch=craycnlOn Cray T3E systems, KAI KCC and Cray CC compilers have been tested with TAU. On Cray SV-1 and X1 systems, Cray CC compilers have been tested with TAU. On Cray XT3, and RedStorm systems, PGI and GNU compilers have been tested with TAU. TAU has also been tested on Cray with KNLs and CCE compilers. -
IBM
On IBM BlueGene (L/P/Q) SP2 and AIX systems. On IBM BG: IBM xlC, blrts_xlC, blrts_xlf90, blrts_xlc, and gnu compilers work with TAU. SP2 and AIX: vKAI KCC, KAP/Pro, IBM xlC, xlc, xlf90 and g++ compilers work with TAU. On IBM pSeries Linux, xlC, xlc, xlf90 and gnu compilers work with TAU.
-
Sun Solaris
Sun compilers (CC, F90), KAI KCC, KAP/Pro and GNU g++ work with TAU.
-
Apple OS X
On Apple OS X machines, c or g may be used to compile TAU. Also, IBM’s xlf90, xlf and Absoft Fortran 90 compilers for G4/G5 may be used with TAU.
-
SGI
-
Accelerators
TAU performance data can be retrived from ATI, Nvidia or Intel GPUs (through OpenCL, or CUDA). Intel Many Intergrated Cores (MIC) is supported in native execution.
-
Intel
-
HP HP-UX
On HP PA-RISC systems, aCC and g++ can be used.
-
HP Alpha Tru64
On HP Alpha Tru64 machines, cxx and g++, and Guide compilers may be used with TAU.
-
NEC SX series vector machines
On NEC SX-5 systems, NEC c++ may be used with TAU.
-
On Hitachi machines, Hitachi KCC, g++ and Hitachi cc compilers may be used with TAU
-
Fujitsu PRIMEPOWER
On Fujitsu Power machines, Sun and Fujitsu compilers may be used with TAU.
-
Microsoft Window
On Windows, Microsoft Visual C++ 6.0 or higher and JDK 1.2+ compilers have been tested with TAU
| TAU has been tested with JDK 1.2, 1.3, 1.4.x under Solaris, SGI, IBM, Linux, and MacOS X. |
1.3. Software Requirements
-
1. Java v 1.5
TAU’s GUI ParaProf and PerfExplorer require Java v1.4 or better in your path. If Java 1.4 is the only version avaible, older version of ParaProf and PerfExplorer can be installed. To do so, simple run either program with Java 1.4 in your path. You will guided through the installation process. ParaProf does not require -jdk=<directory> option to be specified during configuration. (This option is used for configuring TAU for analyzing Java applications.)
2. TAU Instrumentation Options
2.1. Selective Instrumentation Options
Selective Instrumentation File Specification
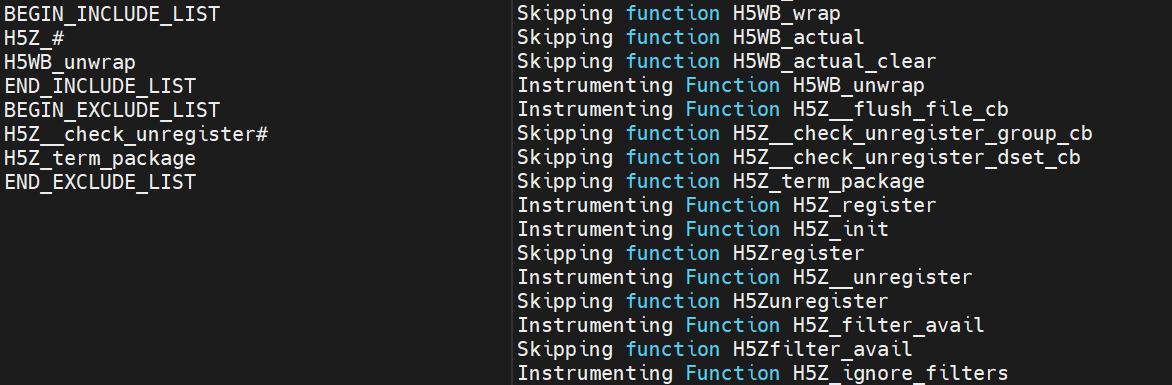
The selective instrumentation file has the following sections, each preceded and followed by:
BEGIN_EXCLUDE_LIST / END_EXCLUDE_LIST or BEGIN_INCLUDE_LIST / END_INCLUDE_LIST
|
exclude/include list of routines and/or files for instrumentation. The list of routines to be excluded from instrumentation is specified, one per line, enclosed by |
BEGIN_FILE_EXCLUDE_LIST / END_FILE_EXCLUDE_LIST or BEGIN_FILE_INCLUDE_LIST / END_FILE_INCLUDE_LIST
|
Similarly, files can be included or excluded with the |
BEGIN_INSTRUMENT_SECTION / END_INSTRUMENT_SECTION
|
Manually editing the selective instrumentation file gives you more options. These tags allow you to control the type of instrumentation performed in certain portions of your application. |
-
Static and Dynamic timers can be set by specifying either a range of line numbers or a routine.
static timer name="foo_bar" file="foo.c" line=17 to line=18
dynamic timer routine="int foo1(int)
-
Static and Dynamic phases can be set by specifying either a range of line numbers or a routine. If you do not configure TAU with
-PROFILEPHASEthese phases will be converted to regular timers.static phase routine="int foo(int) dynamic phase name="foo1_bar" file="foo.c" line=26 to line=27
-
Loops in the source code can be profiled by specifying a routine in which all loop should be profiled, like:
loops file="loop_test.cpp" routine="multiply"
-
With TAU’s memory API options the following events are tracked: memory allocation, memory deallocation, and memory leaks.
memory file="foo.f90" routine="INIT"
-
IO Events track the size, in bytes of read, write, and print statements.
io file="foo.f90" routine="RINB"
Both Memory and IO events are represented along with their call-stack; the length of which can be set with environment variable TAU_CALLPATH_DEPTH .
Selective instrumention can be set at compile time by setting -tau_options=-optTauSelectFile=<file> in the TAU_OPTIONS environment variable when compiling with the TAU compiler wrapper scripts. Alternatively an application can be selectively instrumented at runtime by setting the TAU_SELECT_FILE environment variable to the selective instrumentation file’s location in the application’s execution environment.
|
Due to the limitations of the some compilers (IBM xlf, PGI pgf90, GNU gfortran), the size of the memory reported for a Fortran Array is not the number of bytes but rather the number of elements. |
2.2. Running an application using DynInstAPI
TAU also allows you to dynamically instrument your application using the DynInst package. There are a few limitation to DyInst: 1) only function level events will be captured and 2) your application must be compiled with debugging symbols ( -g ).
To install the DynInstAPI package, configure TAU with -dyinst= option which will point TAU to where dyninst is installed. Use the tau_run tool to instrument your application at runtime.
The command-line options accepted by tau_run are:
Usage: tau_run [-Xrun<Taulibrary> ][-v][-o outfile] \
       [-f <instrumentation file> ] <application> [args]
By default, libTAU . so is loaded by tau_run. However, the user can override this and specify another file using the -Xrun<Taulibrary>. In this case lib<Taulibrary>.so will be loaded using LD_LIBRARY_PATH .
To use tau_run , TAU is configured with DyninstAPI as shown below:
% configure -dyninst=/usr/local/packages/dyninstAPI
% make install
% cd tau/examples/dyninst
% make install
% tau_run klargest 2500 23
% pprof; paraprof
2.3. Rewriting Binaries
2.3.1. Using MAQAO
TAU also allows you to rewrite your application using the MAQAO package included in PDToolkit 3.17 or above( http://tau.uoregon.edu/pdt.tgz ).
Install PDToolkit 3.17+ and configure TAU with -pdt= option which will point TAU to where PDToolkit is installed. Use the tau_rewrite tool to instrument your application. (If TAU is not configured with PDT 3.17+, then tau_rewrite defaults to tau_run.)
% configure -pdt=/usr/local/packages/pdtoolkit-3.17
% make install
% tau_rewrite -T scorep,pdt  -loadlib=/tmp/libfoo.so ./a.out -o a.inst
2.3.2. Using PEBIL
TAU also allows you to rewrite your application using the PEBIL package included in PDToolkit 3.18.1 or above( http://tau.uoregon.edu/pdt.tgz ).
Install PDToolkit 3.18.1 and configure TAU with -pdt= option which will point TAU to where PDToolkit is installed. Use the tau_pebil_rewrite tool to instrument your application.
% tau_pebil_rewrite -T <commands> -f select.tau <exe> [-o] <output_exe>
The select.tau file supports outer-loop level instrumentation and exclude/include lists of functions just like tau_instrumentor’s select.tau (same format). Also, -T <options> are identical to tau_exec -T options.
2.3.3. Using DynInstAPI
TAU also allows you to rewrite your application using the DyninstAPI package.
To install the DynInstAPI, configure TAU with -dyninst= options which will point TAU to where dyninst is installed, you can also use -dyninst=download, and TAU will automatically download and install DynInstAPI and its dependencies.
When configuring TAU with DynInstAPI, it will show the environment variables you need to set, which are DYNINSTAPI_RT_LIB and LD_LIBRARY_PATH .
% ./configure -dyninst=download -bfd=download
% make install
% tau_run -T <commands> -f select.tau <exe> [-o] <output_exe>
The select.tau file supports exclude/include lists of functions just like tau_instrumentor’s select.tau (same format). Also, -T <options> are identical to tau_exec -T options.
In some cases, flags such as -O2 can prevent DynInstAPI from reading the binaries, if possible, applications or libraries should be compiled with the flags -g -fno-ipa-sra -fno-ipa-ra -fno-ipa-vrp -fno-omit-frame-pointer
Library Instrumentation with DynInstAPI
With DynInstAPI instrumentation can be inserted into libraries. The limitations are that the library should be included in an application using RUNPATH instead of RPATH.
To instrument libraries, tau_run is used with the flag -l . Also, the flag -v is useful if selective instrumentation is used.
LD_LIBRARY_PATH can be used instead of -loadlib, but the user must ensure that the correct library is used by the binary.
2.4. Profiling each call to a function
By default TAU profiles the total time (inclusive/exclusive) spent on a given function. Profiling each function call for an application that calls some function hundred of thousands of times, is impractical since the profile data would grow enormously. But configuring TAU with the -PROFILEPARAM option will have TAU profile select functions each time they are called. But TAU will also group some of these function calls together according to the value of the parameter they are given. For example if a function mpisend(int i) is called 2000 times 1000 times with 512 and 1000 times with 1024 then we will receive two profile for mpisend() one we it is called with 512 and one when it is called with 1024. This reduces the overhead since we are profiling mpisend() two times not 2000 times.
2.5. Profiling with Hardware counters
LIST OF COUNTERS:
Set the TAU_METRICS environment variable with a comma separated list of metrics or to use the old method set the following values for the COUNTER<1-25> environment variables.
-
GET_TIME_OF_DAY- For the default profiling option using gettimeofday() -
SGI_TIMERS- For-SGITIMERSconfiguration option under IRIX -
CRAY_TIMERS- For-CRAYTIMERSconfiguration option under Cray X1. -
LINUX_TIMERS- For -LINUXTIMERS configuration option under Linux -
CPU_TIME- For user+system time from getrusage() call with-CPUTIME -
P_WALL_CLOCK_TIME- For PAPI’s WALLCLOCK time using-PAPIWALLCLOCK -
P_VIRTUAL_TIME- For PAPI’s process virtual time using-PAPIVIRTUAL -
TAU_MUSE- For reading counts of Linux OS kernel level events when MAGNET/MUSE is installed and -muse configuration option is enabled. MUSE .TAU_MUSE_PACKAGEenvironment variable has to be set to package name (busy_time, count, etc.) -
TAU_MPI_MESSAGE_SIZE- For tracking the cumulative message size for all MPI operations by a node for each routine. -
ENERGY- For tracking the power use of the application in joules. Requires an -arch=craycnl configuration. -
ACCEL_ENERGY- For tracking the power use of the application on accelerators in joules. Requires an -arch=craycnl configuration.
|
When TAU is configured with -TRACE -MULTIPLECOUNTERS and -papi=<dir> options, the COUNTER1 environment variable must be set to GET_TIME_OF_DAY to allow TAU’s tracing module to use a globally synchronized real-time clock for time-stamping event records. When we use tracing with hardware performance counters, the counters specified in environment variables COUNTER[2-25] are accessed at routine transitions and logged in the trace file. Use tau2vtf tool to convert TAU traces to VTF3 traces that may be loaded in the Vampir trace visualization tool. |
and PAPI/PCL options that can be found in [papi_table] and [pcl_table] . Example:
-
PCL_FP_INSTR- For floating point operations using PCL (-pcl=<dir>) -
PAPI_FP_INS- For floating point operations using PAPI (-papi=<dir>) -
PAPI_NATIVE_<event>- For native papi events using PAPI (-papi=<dir>)
NOTE: When -MULTIPLECOUNTERS is used with -TRACE option, the tracing library uses the wall-clock time from the function specified in the COUNTER1 variable. This should typically point to wall-clock time routines (such as GET_TIME_OF_DAY or SGI_TIMERS or LINUX_TIMERS ).
Example:
% setenv COUNTER1   P_WALL_CLOCK_TIME
% setenv COUNTER2 PAPI_L1_DCM
% setenv COUNTER3 PAPI_FP_INS
will produce profile files in directories called MULT_P_WALL_CLOCK_TIME, MULTI__PAPI_L1_DCM, and MULTI_PAPI_FP_INS.
| TAU_METRICS | EVENT Measured |
|---|---|
PAPI_L1_DCM |
Level 1 data cache misses |
PAPI_L1_ICM |
Level 1 instruction cache misses |
PAPI_L2_DCM |
Level 2 data cache misses |
PAPI_L2_ICM |
Level 2 instruction cache misses |
PAPI_L3_DCM |
Level 3 data cache misses |
PAPI_L3_ICM |
Level 3 instruction cache misses |
PAPI_L1_TCM |
Level 1 total cache misses |
PAPI_L2_TCM |
Level 2 total cache misses |
PAPI_L3_TCM |
Level 3 total cache misses |
PAPI_CA_SNP |
Snoops |
PAPI_CA_SHR |
Request for access to shared cache line (SMP) |
PAPI_CA_CLN |
Request for access to clean cache line (SMP) |
PAPI_CA_INV |
Cache Line Invalidation (SMP) |
PAPI_CA_ITV |
Cache Line Intervention (SMP) |
PAPI_L3_LDM |
Level 3 load misses |
PAPI_L3_STM |
Level 3 store misses |
PAPI_BRU_IDL |
Cycles branch units are idle |
PAPI_FXU_IDL |
Cycles integer units are idle |
PAPI_FPU_IDL |
Cycles floating point units are idle |
PAPI_LSU_IDL |
Cycles load/store units are idle |
PAPI_TLB_DM |
Data translation lookaside buffer misses |
PAPI_TLB_IM |
Instruction translation lookaside buffer misses |
PAPI_TLB_TL |
Total translation lookaside buffer misses |
PAPI_L1_LDM |
Level 1 load misses |
PAPI_L1_STM |
Level 1 store misses |
PAPI_L2_LDM |
Level 2 load misses |
PAPI_L2_STM |
Level 2 store misses |
PAPI_BTAC_M |
BTAC miss |
PAPI_PRF_DM |
Prefetch data instruction caused a miss |
PAPI_L3_DCH |
Level 3 Data Cache Hit |
PAPI_TLB_SD |
Translation lookaside buffer shootdowns (SMP) |
PAPI_CSR_FAL |
Failed store conditional instructions |
PAPI_CSR_SUC |
Successful store conditional instructions |
PAPI_CSR_TOT |
Total store conditional instructions |
PAPI_MEM_SCY |
Cycles Stalled Waiting for Memory Access |
PAPI_MEM_RCY |
Cycles Stalled Waiting for Memory Read |
PAPI_MEM_WCY |
Cycles Stalled Waiting for Memory Write |
PAPI_STL_ICY |
Cycles with No Instruction Issue |
PAPI_FUL_ICY |
Cycles with Maximum Instruction Issue |
PAPI_STL_CCY |
Cycles with No Instruction Completion |
PAPI_FUL_CCY |
Cycles with Maximum Instruction Completion |
PAPI_HW_INT |
Hardware interrupts |
PAPI_BR_UCN |
Unconditional branch instructions executed |
PAPI_BR_CN |
Conditional branch instructions executed |
PAPI_BR_TKN |
Conditional branch instructions taken |
PAPI_BR_NTK |
Conditional branch instructions not taken |
PAPI_BR_MSP |
Conditional branch instructions mispredicted |
PAPI_BR_PRC |
Conditional branch instructions correctly predicted |
PAPI_FMA_INS |
FMA instructions completed |
PAPI_TOT_IIS |
Total instructions issued |
PAPI_TOT_INS |
Total instructions executed |
PAPI_INT_INS |
Integer instructions executed |
PAPI_FP_INS |
Floating point instructions executed |
PAPI_LD_INS |
Load instructions executed |
PAPI_SR_INS |
Store instructions executed |
PAPI_BR_INS |
Total branch instructions executed |
PAPI_VEC_INS |
Vector/SIMD instructions executed |
PAPI_FLOPS |
Floating Point Instructions executed per second |
PAPI_RES_STL |
Cycles processor is stalled on resource |
PAPI_FP_STAL |
FP units are stalled |
PAPI_TOT_CYC |
Total cycles |
PAPI_IPS |
Instructions executed per second |
PAPI_LST_INS |
Total load/store instructions executed |
PAPI_SYC_INS |
Synchronization instructions executed |
PAPI_L1_DCH |
L1 D Cache Hit |
PAPI_L2_DCH |
L2 D Cache Hit |
PAPI_L1_DCA |
L1 D Cache Access |
PAPI_L2_DCA |
L2 D Cache Access |
PAPI_L3_DCA |
L3 D Cache Access |
PAPI_L1_DCR |
L1 D Cache Read |
PAPI_L2_DCR |
L2 D Cache Read |
PAPI_L3_DCR |
L3 D Cache Read |
PAPI_L1_DCW |
L1 D Cache Write |
PAPI_L2_DCW |
L2 D Cache Write |
PAPI_L3_DCW |
L3 D Cache Write |
PAPI_L1_ICH |
L1 instruction cache hits |
PAPI_L2_ICH |
L2 instruction cache hits |
PAPI_L3_ICH |
L3 instruction cache hits |
PAPI_L1_ICA |
L1 instruction cache accesses |
PAPI_L2_ICA |
L2 instruction cache accesses |
PAPI_L3_ICA |
L3 instruction cache accesses |
PAPI_L1_ICR |
L1 instruction cache reads |
PAPI_L2_ICR |
L2 instruction cache reads |
PAPI_L3_ICR |
L3 instruction cache reads |
PAPI_L1_ICW |
L1 instruction cache writes |
PAPI_L2_ICW |
L2 instruction cache writes |
PAPI_L3_ICW |
L3 instruction cache writes |
PAPI_L1_TCH |
L1 total cache hits |
PAPI_L2_TCH |
L2 total cache hits |
PAPI_L3_TCH |
L3 total cache hits |
PAPI_L1_TCA |
L1 total cache accesses |
PAPI_L2_TCA |
L2 total cache accesses |
PAPI_L3_TCA |
L3 total cache accesses |
PAPI_L1_TCR |
L1 total cache reads |
PAPI_L2_TCR |
L2 total cache reads |
PAPI_L3_TCR |
L3 total cache reads |
PAPI_L1_TCW |
L1 total cache writes |
PAPI_L2_TCW |
L2 total cache writes |
PAPI_L3_TCW |
L3 total cache writes |
PAPI_FML_INS |
FM ins |
PAPI_FAD_INS |
FA ins |
PAPI_FDV_INS |
FD ins |
PAPI_FSQ_INS |
FSq ins |
PAPI_FNV_INS |
Finv ins |
For example to measure the floating point operations in routines using PCL ,
% ./configure -pcl=/usr/local/packages/pcl-1.2
% setenv PCL_EVENT PCL_FP_INSTR
% mpirun -np 8 application
| PCL_EVENT | EVENT Measured |
|---|---|
PCL_L1CACHE_READ |
L1 (Level one) cache reads |
PCL_L1CACHE_WRITE |
L1 cache writes |
PCL_L1CACHE_READWRITE |
L1 cache reads and writes |
PCL_L1CACHE_HIT |
L1 cache hits |
PCL_L1CACHE_MISS |
L1 cache misses |
PCL_L1DCACHE_READ |
L1 data cache reads |
PCL_L1DCACHE_WRITE |
L1 data cache writes |
PCL_L1DCACHE_READWRITE |
L1 data cache reads and writes |
PCL_L1DCACHE_HIT |
L1 data cache hits |
PCL_L1DCACHE_MISS |
L1 data cache misses |
PCL_L1ICACHE_READ |
L1 instruction cache reads |
PCL_L1ICACHE_WRITE |
L1 instruction cache writes |
PCL_L1ICACHE_READWRITE |
L1 instruction cache reads and writes |
PCL_L1ICACHE_HIT |
L1 instruction cache hits |
PCL_L1ICACHE_MISS |
L1 instruction cache misses |
PCL_L2CACHE_READ |
L2 (Level two) cache reads |
PCL_L2CACHE_WRITE |
L2 cache writes |
PCL_L2CACHE_READWRITE |
L2 cache reads and writes |
PCL_L2CACHE_HIT |
L2 cache hits |
PCL_L2CACHE_MISS |
L2 cache misses |
PCL_L2DCACHE_READ |
L2 data cache reads |
PCL_L2DCACHE_WRITE |
L2 data cache writes |
PCL_L2DCACHE_READWRITE |
L2 data cache reads and writes |
PCL_L2DCACHE_HIT |
L2 data cache hits |
PCL_L2DCACHE_MISS |
L2 data cache misses |
PCL_L2ICACHE_READ |
L2 instruction cache reads |
PCL_L2ICACHE_WRITE |
L2 instruction cache writes |
PCL_L2ICACHE_READWRITE |
L2 instruction cache reads and writes |
PCL_L2ICACHE_HIT |
L2 instruction cache hits |
PCL_L2ICACHE_MISS |
L2 instruction cache misses |
PCL_TLB_HIT |
TLB (Translation Lookaside Buffer) hits |
PCL_TLB_MISS |
TLB misses |
PCL_ITLB_HIT |
Instruction TLB hits |
PCL_ITLB_MISS |
Instruction TLB misses |
PCL_DTLB_HIT |
Data TLB hits |
PCL_DTLB_MISS |
Data TLB misses |
PCL_CYCLES |
Cycles |
PCL_ELAPSED_CYCLES |
Cycles elapsed |
PCL_INTEGER_INSTR |
Integer instructions executed |
PCL_FP_INSTR |
Floating point (FP) instructions executed |
PCL_LOAD_INSTR |
Load instructions executed |
PCL_STORE_INSTR |
Store instructions executed |
PCL_LOADSTORE_INSTR |
Loads and stores executed |
PCL_INSTR |
Instructions executed |
PCL_JUMP_SUCCESS |
Successful jumps executed |
PCL_JUMP_UNSUCCESS |
Unsuccessful jumps executed |
PCL_JUMP |
Jumps executed |
PCL_ATOMIC_SUCCESS |
Successful atomic instructions executed |
PCL_ATOMIC_UNSUCCESS |
Unsuccessful atomic instructions executed |
PCL_ATOMIC |
Atomic instructions executed |
PCL_STALL_INTEGER |
Integer stalls |
PCL_STALL_FP |
Floating point stalls |
PCL_STALL_JUMP |
Jump stalls |
PCL_STALL_LOAD |
Load stalls |
PCL_STALL_STORE |
Store Stalls |
PCL_STALL |
Stalls |
PCL_MFLOPS |
Millions of floating point operations/second |
PCL_IPC |
Instructions executed per cycle |
PCL_L1DCACHE_MISSRATE |
Level 1 data cache miss rate |
PCL_L2DCACHE_MISSRATE |
Level 2 data cache miss rate |
PCL_MEM_FP_RATIO |
Ratio of memory accesses to FP operations |
2.6. Using Hardware Performance Counters
While running the application, set the environment variable PCL_EVENT or TAU_METRICS , to specify which hardware performance counter TAU should use while profiling the application.
|
By default, only one counter is tracked at a time. To track more than one counter use |
To select floating point instructions for profiling using PAPI , you would:
% configure -papi=/usr/local/packages/papi-3.5.0
% make clean install
% cd examples/papi
% setenv TAU_METRICS PAPI_FP_INS
% a.out
In addition to the following events, you can use native events (see papi_native ) on a given CPU by setting TAU_ to PAPI_NATIVE_<event> . For example:
% setenv PAPI_NATIVE PAPI_NATIVE_PM_BIQ_IDU_FULL_CYC
% a.out
By default PAPI will profile events in all domains (users space, kernel, hypervisor, etc). You can restrict the set of domains for papi event profiling by using the TAU_PAPI_DOMAIN environment variable with these values (in a colon separated list, if desired): PAPI_DOM_USER, PAPI_DOM_KERNEL, PAPI_DOM_SUPERVISOR, and PAPI_DOM_OTHER like thus:
% setenv TAU_PAPI_DOMAIN PAPI_DOM_SUPERVISOR:PAPI_DOM_OTHER
2.7. Profiling with PerfLib
This profiling option is currently under development at LANL.
To configure TAU with PerfLib use the following arguments:
%> configure -perflib=[path_to_perflib lib directory]
             -perfinc=[path_to_perflib inc directory]
             -perflibrary=[argument send to the linker if different than default]

    After TAU is built a new Makefile will be generated with *-perflib-* in its
    name, use this Makefile when profiling applications with perflib.
After TAU is built a new Makefile will be generated with -perflib- in its name, use this Makefile when profiling applications with perflib.
After configuration and installation, toggle these three environment variables before running the application:
%> export PERF_PROFILE=1
%> export PERF_PROFILE_MPI=1
%> export PERF_PROFILE_MEMORY=1
%> export PERF_PROFILE_COUNTERS=1
%> export PERF_DATA_DIRECTORY=<directory>
We also provide a perf2tau conversion utilities to convert the remaining perflib profiles to regular TAU profiles. To use perf2tau set the environment variable perf_data_directory to the type of the profiling to be converted (the directory where the data is store will be called something like perf_data.[type]/). Or you may execute perf2tau with the type as an argument:
%> perf2tau [type]
See also the man page for perf2tau, perf2tau .
2.8. Running a Python application with TAU
TAU can automatically instrument all Python routines when the tau python package is imported. Add <TAUROOT>/<ARCH>/lib/bindings-<options> to the PYTHONPATH environment variable in order to use the TAU module.
To execute the program, tau.run routine is invoked with the name of the top level Python code. For e.g.,
#!/usr/bin/env python

import tau
from time import sleep

def f2():
    print "Inside f2: sleeping for 2 secs..."
    sleep(2)
def f1():
    print "Inside f1, calling f2..."
    f2()

def OurMain():
    f1()

tau.run('OurMain()')
instruments routines OurMain(), f1() and f2() although there are no instrumentation calls in the routines. To use this feature, TAU must be configured with the -pythoninc=<dir> option (and -pythonlib=<dir> if running under IBM). Before running the application, the environment variable PYTHONPATH and LD_LIBRARY_PATH should be set to include the TAU library directory (where tau.py is stored). Manual instrumentation of Python sources is also possible using the Python API and the pytau package. For e.g.,
#!/usr/bin/env python

import pytau
from time import sleep

x = pytau.profileTimer("A Sleep for excl 5 secs")
y = pytau.profileTimer("B Sleep for excl 2 secs")
pytau.start(x)
print "Sleeping for 5 secs ..."
sleep(5)
pytau.start(y)
print "Sleeping for 2 secs ..."
sleep(2)
pytau.stop(y)
pytau.dbDump()
pytau.stop(x)
shows how two timers x and y are created and used. Note, multiple timers can be nested, but not overlapping. Overlapping timers are detected by TAU at runtime and flagged with a warning (as exclusive time is not defined when timers overlap).
2.9. Running a Julia application with TAU
Julia applications are profiled using tau_julia , which is a wrapper around julia that makes the TAUProfile module available automatically. TAU provides the TAUProfile.jl package with three instrumentation approaches: manual timers, macro-based instrumentation, and automatic whole-program instrumentation.
To use Julia support, configure TAU with the -julia and -ittnotify flags. The -ittnotify flag enables TAU to resolve symbols in JIT-compiled Julia code when using event-based sampling.
% ./configure -bfd=download -dwarf=download -julia -ittnotify
% make clean install
For MPI or CUDA support, combine flags as needed:
% ./configure -bfd=download -dwarf=download -julia -ittnotify \
    -mpi -c++=mpicxx -cc=mpicc -fortran=mpif90
% ./configure -bfd=download -dwarf=download -julia -ittnotify \
    -cuda=/path/to/cuda
|
Do not use |
To run a Julia script with TAU profiling, use tau_julia . A -- separator separates tau_julia flags from Julia arguments:
% tau_julia -T serial,julia,ittnotify -- script.jl
% pprof
tau_julia accepts the same flags as tau_exec . Use -T to select a TAU configuration:
% tau_julia -T julia,ittnotify,mpi -- mpi_script.jl
% tau_julia -T julia,ittnotify,cupti -cupti -- cuda_script.jl
% tau_julia -T julia,ittnotify -ittnotify -ebs -- script.jl
When using event-based sampling (-ebs), pass -ittnotify as a tau_julia flag so that sampled addresses in JIT-compiled Julia code can be resolved to function names.
2.9.1. Manual Timers
The simplest form of instrumentation uses tau_start and tau_stop to bracket regions of code. The TAUProfile module is automatically available when using tau_julia .
using TAUProfile

function manual_timing_example()
    tau_start("manual_timing_example")
    println("Hello world!")
    sleep(0.5)
    result = sum(rand(1000, 1000))
    tau_stop("manual_timing_example")
    return result
end

manual_timing_example()
Every tau_start must have a matching tau_stop . Mismatched calls produce incorrect profiles. If the timed region can throw an exception, use the @tau macro instead.
2.9.2. Macro Instrumentation
The @tau macro wraps an expression with TAU timing. The timer is automatically stopped when the expression completes, including when an exception is thrown. @tau blocks can be nested.
using TAUProfile

result = @tau "outer_timer" begin
    sleep(0.2)

    result1 = @tau "inner_computation_1" begin
        sleep(0.1)
        sum(rand(100, 100))
    end

    result2 = @tau "inner_computation_2" begin
        sleep(0.1)
        sum(rand(200, 200))
    end

    result1 + result2
end
The @tau_func macro wraps an entire function definition with TAU timing. The timer name is derived from the function name automatically. It works with both standard and short-form function definitions.
@tau_func function matrix_multiply(A, B)
    return A * B
end

@tau_func quick_sum(arr) = sum(arr)
2.9.3. Automatic Instrumentation with @tau_rewrite
The @tau_rewrite macro provides whole-program automatic instrumentation. It compiles the target function and all its callees with TAU entry/exit hooks inserted automatically.
using TAUProfile

function fibonacci(n)
    if n <= 1
        return n
    end
    return fibonacci(n - 1) + fibonacci(n - 2)
end

function recursive_example()
    result = fibonacci(10)
    return result
end

my_sum(arr) = sum(arr)

function rewrite_example()
    println(recursive_example())
    arr = collect(1:100)
    s = my_sum(arr)
    println(s)
end

@tau_rewrite rewrite_example()
In this example, rewrite_example , recursive_example , fibonacci , and my_sum are all automatically instrumented, along with any library functions they call. After the call completes, the original uninstrumented method sources are restored.
2.9.4. Selective Instrumentation for @tau_rewrite
By default, @tau_rewrite instruments the entire call graph, which can produce very large profiles. Several functions are available to control which functions are instrumented. These must be called before @tau_rewrite .
Excluding and Including Modules
tau_rewrite_exclude_module excludes all functions defined in a module from instrumentation. By default, submodules are also excluded. Pass exact=true to exclude only the exact module. Accepts Module objects, Symbols, or Strings. Multiple modules can be passed in a single call.
tau_rewrite_exclude_module(Base)
tau_rewrite_exclude_module(:Base, :GPUArrays, :GPUCompiler)
tau_rewrite_exclude_module(Base; exact=true)
tau_rewrite_include_module_only provides a whitelist. When the whitelist is non-empty, only functions in whitelisted modules are instrumented.
tau_rewrite_include_module_only(MyModule)
tau_rewrite_include_module_only(ModA, ModB)
Excluding Functions
tau_rewrite_exclude_function excludes specific functions by function object, Symbol, or String. tau_rewrite_exclude_prefix excludes all functions whose name starts with a given prefix.
tau_rewrite_exclude_function(my_helper)
tau_rewrite_exclude_function(:my_helper)
tau_rewrite_exclude_prefix("_internal_")
Depth Limits
tau_rewrite_set_recursion_limit controls how deep into the call graph instrumentation reaches. A global limit controls the maximum depth from the root function. Per-module limits control depth within a specific module’s call chain and reset when crossing module boundaries. Setting n=0 means unlimited (the default).
tau_rewrite_set_recursion_limit(4)
tau_rewrite_set_recursion_limit(Base, 2)
@tau_rewrite main()
Deferred Execution Contexts
By default, functions called only from @spawn , @async , or callbacks may not be instrumented. Enable tau_rewrite_deferred_contexts to instrument these as well:
tau_rewrite_deferred_contexts(true)
@tau_rewrite main()
2.9.5. Multithreaded Julia
TAU supports profiling multithreaded Julia programs. Start Julia with multiple threads and enable deferred context tracing to ensure spawned tasks are instrumented:
% JULIA_NUM_THREADS=8 tau_julia -T julia,ittnotify,pthread -- script.jl
using Base.Threads
using TAUProfile

function worker(id::Int, n::Int)
    total = zero(Float64)
    for i in 1:n
        total += sin(Float64(i) * 0.001)
    end
    return total
end

function main()
    tasks = [@spawn(worker(i, 1_000_000)) for i in 1:100]
    results = fetch.(tasks)
    println("Sum: $(sum(results))")
end

tau_rewrite_exclude_module(Base)
tau_rewrite_deferred_contexts(true)
@tau_rewrite main()
2.9.6. Complete Example
This example demonstrates a typical workflow combining @tau_rewrite with depth limits to control profile size:
using Printf: @printf
using TAUProfile

function profile_test(n)
    @printf "Running loop of size %d\n" n
    for i = 1:n
        A = randn(100, 100, 20)
        m = maximum(A)
        Am = mapslices(sum, A; dims=2)
        B = A[:, :, 5]
        Bsort = mapslices(sort, B; dims=1)
        b = rand(100)
        C = B .* b
    end
end

function main()
    profile_test(1)
    profile_test(10)
    profile_test(100)
end

tau_rewrite_set_recursion_limit(4)
tau_rewrite_set_recursion_limit(Base, 2)
@tau_rewrite main()
% tau_julia -T serial,julia,ittnotify -- script.jl
% pprof
2.9.7. TAUProfile.jl API Summary
| Function | Description |
|---|---|
|
Start a named TAU timer. |
|
Stop a named TAU timer. |
|
Time an expression with automatic start/stop and exception safety. |
|
Wrap a function definition with automatic timing. |
|
Automatically instrument |
|
Functional form of |
|
Compile with instrumentation and return a callable wrapper. |
|
Exclude a function from automatic instrumentation. |
|
Exclude functions matching a name prefix. |
|
Exclude a module (and optionally its submodules). |
|
Whitelist a module; only whitelisted modules are instrumented. |
|
Set global call depth limit. |
|
Set per-module call depth limit. |
|
Skip trivial functions below a complexity threshold. |
|
Enable/disable instrumentation of |
|
Include/exclude argument types in timer labels. |
|
Reset all instrumentation options to defaults. |
2.10. pprof
pprof sorts and displays profile data generated by TAU. To view the profile, merely execute pprof in the directory where profile files are located (or set the PROFILEDIR environment variable).
% pprof
Its usage is explained below:
usage: pprof [-c|-b|-m|-t|-e|-i] [-r] [-s] [-n num] [-f filename] \
       [-l] [node numbers]
  -c : Sort by number of Calls
  -b : Sort by number of suBroutines called by a function
  -m : Sort by Milliseconds (exclusive time total)
  -t : Sort by Total milliseconds (inclusive time total) (DEFAULT)
  -e : Sort by Exclusive time per call (msec/call)
  -i : Sort by Inclusive time per call (total msec/call)
  -v : Sort by standard deViation (excl usec)
  -r : Reverse sorting order
  -s : print only Summary profile information
  -n num : print only first num functions
  -f filename : specify full path and Filename without node ids
  -p : suPpress conversion to hh:mm:ss:mmm format
  -l : List all functions and exit
  -d : Dump output format (for Racy) [node numbers] : prints only info about
	all contexts/threads of given node numbers
 node numbers : prints information about all contexts/threads
 for specified nodes
2.11. Running a JAVA application with TAU
Java applications are profiled/traced using tau_java as shown below:
% cd tau/examples/java/pi
% setenv LD_LIBRARY_PATH $LD_LIBRARY_PATH:<tauroot>/<arch>/lib
% tau_java  Pi
More information about tau_java can be found in the Tools section of the Reference Guide.
Running the application generates profile files with names having the form profile.<node>.<context>.<thread>. These files can be analyzed using pprof or paraprof.
2.12. Using a tau.conf File
If a tau.conf file is created, then code that uses that TAU lib will effected by the settings in tau.conf. For example, if a directory tau-2.21/tau_system_defaults is created and a tau.conf file is placed in it, TAU will read that file before doing the measurements. A user of that TAU libs can choose to override the contents of that file by placing a tau.conf in their own directory. But by default, if the sysadmin chooses to create this dir, all the users of the TAU libs will be globally affected by this tau.conf.
For example, tau.conf could be:
% cat tau.conf
TAU_LOG_PATH=/soft/apps/tau/logs
PROFILEDIR=$TAU_LOG_DIR
TAU_PROFILE_FORMAT=merged
TAU_SUMMARY=1
TAU_IBM_BG_HWP_COUNTERS=1
TAU_TRACK_MESSAGE=1
Then anyone using TAU from that directory will get TAU_IBM_BG_HWP_COUNTERS=1, TAU_TRACK_MESSAGE=1, etc.
2.13. Using Score-P with TAU
TAU can be configured to use the Score-P measurement infrastructure (www.score-p.org). To use Score-P, configure TAU with -scorep= option to point TAU to the Score-P installation. (Please use Score-P version 1.0 beta or above.) You may then instrument and run your application with TAU in a manor of your choosing.
Set the environment variable SCOREP_PROFILING_FORMAT to TAU_SNAPSHOT to produce TAU Snapshot files, which will be found in scorep*/tau/. Also, the Score-P library must be found in LD_LIBRARY_PATH.
2.14. Using UPC with TAU
Please see examples/upc for more details.
To instrument Berkeley UPC with GASP, configure TAU with -upcnetwork=<option> /where option is "mpi" or "udp". Then use a selective instrumentation file like the one shown below.
BEGIN_INSTRUMENT_SECTION
forall routine="#"
loops routine="#"
barrier routine="#"
fence routine="#"
notify routine="#"
END_INSTRUMENT_SECTION
Then tau_upc.sh can be used to build the application. If "udp" is used with -upcnetwork, then upcrun can be used to run the application. For "mpi", mpirun or a similar mechanism can be used.
To instrument UPC with Cray CCE compilers, the following will produce a configuration that supports Cray UPC and may be used with tau_upc.sh
module load PrgEnv-cray
./configure -arch=craycnl -pdt=<dir> -pdt_c++=g++
TAU can also build the DMAPP wrapper using Cray CCE compilers. When the -optDMAPP option is used when building the application with TAU using TAU_OPTIONS, DMAPP events are automatically instrumented with tau_upc.sh.
3. Tracing
3.1. How to configure tracing
TAU must be configured with the -TRACE option to generate event traces. This can be used in conjunction with -PROFILE to generate both profiles and traces. The traces are stored in a directory specified by the environment variable TRACEDIR , or the current directory, by default. The environment variables TAU_TRACEFILE may be used to specify the name of Vampir trace file. When this variable is set, trace files are automatically merged and the tau2vtf is invoked to convert the merged trace file to VTF3 trace format. This conversion takes place on node 0, thread 0. The intermediate trace files are deleted. To retain the trace files, the user can set the environment variable TAU_KEEP_TRACEFILES to true. When TAU_TRACEFILE is not specified, the user needs to merge and convert the traces as below. Example:
% ./configure -arch=sgi64 -TRACE  -mpi -vtf=/usr/local/vtf3-1.34 -slog2
% make clean; make install
% setenv TRACEDIR /users/sameer/tracedata/experiment56
% mpirun -np 4 matrix
This generates files named
tautrace.<node>.<context>.<thread>.trc and events.<node>.edf
When generating a Vampir Trace Format (otf or vtf) these environment variables maybe helpful:
-
VT_FILE_PREFIXPrefix used for trace filenames. Default is "a". -
VT_COMPRESSIONWrite compressed trace files? Default is "yes"
Using the utility tau_treemerge.pl, these traces are then merged as shown below:
% tau_treemerge.pl
This generates tau.trc as the merged trace file and tau.edf as the merged event description file.
tau_treemerge.pl can take an optional argument (with -n <value>) to specify the maximum number of trace files to merge in each invocation of tau_merge. If we need to merge 2000 trace files and if the maximum number of open files specified by unix is 250, tau_treemerge.pl will incrementally merge the trace files so as not to exceed the number of open file descriptors. This is important for the IBM BlueGene/L machine where such restrictions are present on the front-end node.
To convert merged or per-thread traces to another trace format, the utilities, tau2otf, tau_convert, tau2vtf, or tau2slog2 are used as shown below:
Usage: tau2otf [ -n  streams  ] [ -nomessage  ] [ -v  ] [ -z ]
 -n streams : Specifies the number of output streams (default is 1)
 -nomessage : Suppresses printing of message information in the trace
 -v         : Verbose mode sends trace event descriptions to the standard output
 as they are converted
 -z         : Compressed output
Here is an example:
%> tau2otf tau.trc tau.edf out.otf
Converting to Vampir’s VTF format:
% tau2vtf
Usage: tau2vtf <TAU trace> <edf file> <out file> [-a|-fa]
               [-nomessage] [-v]
 -a         : ASCII VTF3 file format
 -fa        : FAST ASCII VTF3 file format
 -nomessage : Suppress printing of message information in the trace
 -v         : Verbose
 Default trace format of <out file> is VTF3 binary
 e.g.,
 tau2vtf merged.trc tau.edf app.vpt.gz
% tau2vtf matrix.trc tau.edf matrix.vpt.gz
% vampir matrix.vpt.gz
To generate slog2 trace files that may be visualized using Jumpshot, we recommend using the slog2 SDK and Jumpshot bundled with TAU.
% configure -slog2 -TRACE ...
% tau2slog2
tau2slog2 converts a TAU formatted trace file to the SLOG2 format
          for Jumpshot trace visualizer
Usage: tau2slog2 <tau_tracefile> <edf_file> -o <slog_tracefile>
For e.g.,
% tau2slog2 app.trc tau.edf -o app.slog2
To generate traces that may be visualized using Vampir, we recommend using tau2vtf over the older tau_convert tool. tau2vtf can produce binary traces with user-defined events (hardware performance counters from PAPI etc.) while tau_convert cannot do this. Binary traces load faster in Vampir.
% tau_convert
usage: tau_convert [-alog | -SDDF | -dump | -paraver [-t] | -pv |
       -vampir [-longsymbolbugfix] [-compact] [-user|-class|-all]
       [-nocomm]] inputtrc edffile [outputtrc]
 Note: -vampir option assumes multiple threads/node
 Note: -t option used in conjunction with -paraver option assumes
       multiple threads/node
To view the dump of the trace in text form, use
% tau_convert -dump matrix.trc tau.edf
tau_convert can also be used to convert traces to the Vampir trace format. For single-threaded applications (such as the MPI application above), the -pv option is used to generate Vampir traces as follows:
% tau_convert -pv matrix.trc tau.edf matrix.pv
% vampir matrix.vpt.gz &
To convert TAU traces to SDDF or ALOG trace formats, -SDDF and -alog options may be used. When multiple threads are used on a node (as with -jdk, -pthread or -tulipthread options during configure), the -vampir option is used to convert the traces to the vampir trace format, as shown below:
% tau_convert -vampir smartsapp.trc tau.edf smartsapp.pv
% vampir smartsapp.pv &
To convert to the Paraver trace format, use the -paraver option for single threaded programs and -paraver -t option for multi-threaded programs.
NOTE: To ensure that inter-process communication events are recorded in the traces, in addition to the routine transitions, it is necessary to insert TAU_TRACE_SENDMSG and TAU_TRACE_RECVMSG macro calls in the source code during instrumentation. This is not needed when the TAU MPI wrapper library is used.
Vampir format traces may be converted to TAU profiles using the vtf2profile tool.
% vtf2profile -f matrix.vpt.gz -p profiledatadir
% vtf2profile
Usage: vtf2profile [options]
***************************HELP***************************
* '-h' display this help text.                         *
* '-c' open command line interface.                    *
* '-f' used as -f <VTF File> where                     *
*        VTF File is the name of the trace file          *
*        to be converted to TAU profiles.                *
* '-p' used as -p <path> where 'path' is the relative  *
*        path to the directory where profiles are to     *
*        stored.                                         *
* '-i' used as -i <from> <to> where 'from' and 'to' are*
*        integers to mark the desired profiling interval.*
**********************************************************
4. TAU Memory Profiling Tutorial
4.1. TAU’s memory API options
TAU can evaluate the following memory events:
-
Memory utilization options that examine how much heap memory is currently used, and
-
Memory headroom evaluation options that examine how much a program can grow (or how much headroom it has) before it runs out of free memory on the heap. During memory headroom evaluation TAU tries to call malloc with chunks that progressively increase in size, until all memory is exhausted. Then it frees those chunks, keeping track of how much memory it successfully allocated.
-
Memory leaks in C/C++ programs TAU will track malloc through the execuation issuing user event when the program fails to the allocated memory.
4.2. Using tau_exec
The tau_exec command allow you to track these memory events with either an instrumented or uninstrumented binary. If you want to instead track memory usage in select locations in the source code consider the TAU API calls below.
4.3. Evaluating Memory Utilization
4.3.1. TAU_TRACK_MEMORY
When TAU_TRACK_MEMORY is called an interrupt is generated every 10 seconds and the memory event is triggered with the current value. This interrupt interval can be changed by calling TAU_SET_INTERRUPT_INTERVAL(value) . The tracking of memory events in both cases can be explictly enabled or disabled by calling the macros TAU_ENABLE_TRACKING_MEMORY() or TAU_DISABLE_TRACKING_MEMORY() respectively.
TAU_TRACK_MEMORY() can be inserted into the source code:
int main(int argc, char **argv)
{
	TAU_PROFILE("main()", " ", TAU_DEFAULT);
	TAU_PROFILE_SET_NODE(0);

	TAU_TRACK_MEMORY();

	sleep(12);

	int *x = new int[5*1024*1024];

	sleep(12);

	return 0;
}


			Resulting profile data:
Resulting profile data:
USER EVENTS Profile :NODE 0, CONTEXT 0, THREAD 0
---------------------------------------------------------------------------------------
NumSamples   MaxValue   MinValue  MeanValue  Std. Dev.  Event Name
---------------------------------------------------------------------------------------
         2  2.049E+04      2.891  1.024E+04  1.024E+04  Memory Utilization
			(heap, in KB)
---------------------------------------------------------------------------------------
4.3.2. TAU_TRACK_MEMORY_HERE
Triggers memory tracking at a given execution point. For example:
int main(int argc, char **argv) {
	TAU_PROFILE("main()", " ", TAU_DEFAULT);
	TAU_PROFILE_SET_NODE(0);

	TAU_TRACK_MEMORY_HERE();

	int *x = new int[5*1024*1024];
	TAU_TRACK_MEMORY_HERE();
	return 0;
}
Here is the resulting profile:
USER EVENTS Profile :NODE 0, CONTEXT 0, THREAD 0
---------------------------------------------------------------------------------------
NumSamples   MaxValue   MinValue  MeanValue  Std. Dev.  Event Name
---------------------------------------------------------------------------------------
         2  2.049E+04      2.891  1.024E+04  1.024E+04  Memory Utilization
			(heap, in KB)
---------------------------------------------------------------------------------------
4.3.3. TAU_TRACK_MEMORY_FOOTPRINT
Similar to TAU_TRACK_MEMORY but uses the Virtual Memory Resident Set Size (VmRSS) and High Water Mark (VmHWM) to produce an interval event and an atomic event respectively.
4.3.4. TAU_TRACK_MEMORY_FOOTPRINT_HERE
Similar to TAU_TRACK_MEMORY_HERE but uses the Virtual Memory Resident Set Size (VmRSS) and High Water Mark (VmHWM) to produce an interval event and an atomic event respectively.
4.3.5. -PROFILEMEMORY
Specifies tracking heap memory utilization for each instrumented function. When any function entry takes place, a sample of the heap memory used is taken. This data is stored as user-defined event data in profiles/traces.
4.4. Evaluating Memory Headroom
4.4.1. TAU_TRACK_MEMORY_HEADROOM()
This call sets up a signal handler that is invoked every 10 seconds by an interrupt. Inside, it evaluates how much memory it can allocate and associates it with the callstack. The user can vary the size of the callstack by setting the environment variable TAU_CALLSTACK_DEPTH (default is 2). The examples/headroom/track subdirectory has an example that illustrates the use of this call. To disable tracking this headroom at runtime, the user may call: TAU_DISABLE_TRACKING_MEMORY_HEADROOM() and call TAU_ENABLE_TRACKING_MEMORY_HEADROOM() to re-enable tracking of the headroom. To set a different interrupt interval, call TAU_SET_INTERRUPT_INTERVAL(value) where value (in seconds) represents the inter-interrupt interval.
A sample profile generated has:
USER EVENTS Profile :NODE 0, CONTEXT 0, THREAD 0
---------------------------------------------------------------------------------------
NumSamples   MaxValue   MinValue  MeanValue  Std. Dev.  Event Name
---------------------------------------------------------------------------------------
         3       4067       4061       4065      2.828  Memory Headroom Left (in
			MB)
         3       4067       4061       4065      2.828  Memory Headroom
         Left (in MB) : void quicksort(int *, int, int)   => void
         quicksort(int *, int, int)
--------------------------------------------------------------------------------
4.4.2. TAU_TRACK_MEMORY_HEADROOM_HERE()
Sometimes it is useful to track the memory available at a certain point in the program, rather than rely on an interrupt. TAU_TRACK_MEMORY_HEADROOM_HERE() allows us to examine the memory available at a particular location in the source code and associate it with the currently executing callstack. The examples/headroom/here subdirectory has an example that illustrates this usage.
ary = new double [1024*1024*50];
    TAU_TRACK_MEMORY_HEADROOM_HERE(); /* takes a sample here!  */
	   sleep(1);
A sample profile looks like this:
USER EVENTS Profile :NODE 0, CONTEXT 0, THREAD 0
---------------------------------------------------------------------------------------
NumSamples   MaxValue   MinValue  MeanValue  Std. Dev.  Event Name
---------------------------------------------------------------------------------------
         3       3672       3672       3672          0  Memory Headroom Left (in
			MB)
         1       3672       3672       3672          0  Memory Headroom
						Left (in MB) : main() (calls f1, f5) => f1() (sleeps 1 sec,
						calls f2, f4)
         1       3672       3672       3672          0  Memory
						Headroom Left (in MB) : main() (calls f1, f5) => f1()
						(sleeps 1 sec, calls f2, f4) => f4() (sleeps 4 sec,
						calls f2)
         1       3672       3672       3672			  0  Memory Headroom Left
						(in MB) : main() (calls f1, f5) => f5() (sleeps 5 sec)
---------------------------------------------------------------------------------------
4.4.3. -PROFILEHEADROOM
Similar to the -PROFILEMEMORY configuration option that takes a sample of the memory utilization at each function entry, we now have -PROFILEHEADROOM . In this -PROFILEHEADROOM option, a sample is taken at instrumented function’s entry and associated with the function name. This option is meant to be used as a debugging aid due the high cost associated with executing a series of malloc calls. The cost was 106 microseconds on an IBM BG/L (700 MHz CPU). To use this option, simply configure TAU with the -PROFILEHEADROOM option and choose any method for instrumentation (PDT, MPI, hand instrumentation). You do not need to annotate the source code in any special way (as is required for 2a and 2b). The examples/headroom/available subdirectory has a simple example that produces the following profile when TAU is configured with the -PROFILEHEADROOM option.
USER EVENTS Profile :NODE 0, CONTEXT 0, THREAD 0
---------------------------------------------------------------------------------------
NumSamples   MaxValue   MinValue  MeanValue  Std. Dev.  Event Name
---------------------------------------------------------------------------------------
         1       4071       4071       4071          0  f1() (sleeps 1 sec,
			calls f2, f4) - Memory Headroom Available (MB)
         2       3671       3671       3671          0  f2() (sleeps 2
			sec, calls f3) - Memory Headroom Available (MB)
         2       3671       3671       3671          0  f3() (sleeps 3 sec) -
			Memory Headroom Available (MB)
         1       3671       3671       3671          0  f4() (sleeps 4 sec,
			calls f2) - Memory Headroom Available (MB)
         1       3671       3671       3671          0  f5() (sleeps 5 sec) -
			Memory Headroom Available (MB)
         1       4071       4071       4071          0  main() (calls f1, f5)
			- Memory Headroom Available (MB)
---------------------------------------------------------------------------------------
4.5. DetectingMemoryLeaks
TAU’s memory leak detection feature can be initiated by giving tau_compiler.sh the option -optDetectMemoryLeaks . For a demonstration consider this C++ program:
#include <stdio.h>
#include <malloc.h>


/* there is a memory leak in bar when it is invoked with 5 < value <= 15 */
int bar(int value)
{
  printf("Inside bar: %d\n", value);
  int *x;

  if (value > 5)
  {
    printf("looks like it came here from g!\n");
    x = (int *) malloc(sizeof(int) * value);
    x[2]= 2;
    /* do not free it! create a memory leak, unless the value is > 15 */
    if (value > 15) free(x);
  }
  else
  { /* value  <=5 no leak */
    printf("looks like it came here from foo!\n");
    x = (int *) malloc(sizeof(int) * 45);
    x[23]= 2;
    free(x);
  }
  return 0;
}

int g(int value)
{
  printf("Inside g: %d\n", value);
  return bar(value);
}

int foo(int value)
{
  printf("Inside f: %d\n", value);

  if (value > 5) g(value);
  else bar(value);

  return 0;
}
int main(int argc, char **argv)
{
  int *x;
  int *y;
  printf ("Inside main\n");

  foo(12); /* leak */
  foo(20); /* no leak */
  foo(2);  /* no leak */
  foo(13); /* leak */
}
Notice that bar fails to free allocated memory on input between 5 and 15 and that foo will call g that calls bar when the input to foo is greater than 5.
Now configuring TAU with -PROFILECALLPATH run the file by:
%> cd examples/memoryleakdetect/
%> make
%> ./simple
...
USER EVENTS Profile :NODE 0, CONTEXT 0, THREAD 0
---------------------------------------------------------------------------------------
NumSamples   MaxValue   MinValue  MeanValue  Std. Dev.  Event Name
---------------------------------------------------------------------------------------
         2         52         48         50          2  MEMORY LEAK! malloc size <file=simple.inst.cpp, line=18> : int g(int)   => int bar(int)
         1         80         80         80          0  free size <file=simple.inst.cpp, line=21>
         1         80         80         80          0  free size <file=simple.inst.cpp, line=21> : int g(int)   => int bar(int)
         1        180        180        180          0  free size <file=simple.inst.cpp, line=28>
         1        180        180        180          0  free size <file=simple.inst.cpp, line=28> : int foo(int)   => int bar(int)
         3         80         48         60      14.24  malloc size <file=simple.inst.cpp, line=18>
         3         80         48         60      14.24  malloc size <file=simple.inst.cpp, line=18> : int g(int)   => int bar(int)
         1        180        180        180          0  malloc size <file=simple.inst.cpp, line=26>
         1        180        180        180          0  malloc size <file=simple.inst.cpp, line=26> : int foo(int)   => int bar(int)
---------------------------------------------------------------------------------------
Notice that the first row show the two Memory leaks along with the callpath tracing where the unallocated memory was requested.
4.6. Memory Tracking In Fortran
To profile memory usage in Fortran 90 use TAU’s ability to selectively instrument a program. The option -optTauSelectFile=<file> for tau_compilier.sh let you specify a selective instrumentation file which defines regions of the source code to instrument.
To begin memory profiling, state which file/routines to profile by typing:
BEGIN_INSTRUMENT_SECTION
memory file="memory.f90" routine="INIT"
END_INSTRUMENT_SECTION
Wildcard can be used to instrument multiple routines. For file names * character can be used to specify any number of character, thus foo* matches foobar, foo2, etc. also for file names ? can match a single charater, ie. foo? matches foo2, fooZ, but not foobar. You can use # as a wildcard for routines, ie. b# matches bar, b2z etc.
Memory Profile in Fortran gives you these three metrics:
-
Total size of memory for each
mallocandfreein the source code. -
The callpath for each occurrence of
mallocorfree. -
A list of all variable that were not deallocated in the source code.
|
Due to the limitations of the |
Here is the profile for the example/memoryleakdetect/f90/foo.f90 file.
%> pprof
..
---------------------------------------------------------------------------------------
NumSamples   MaxValue   MinValue  MeanValue  Std. Dev.  Event Name
---------------------------------------------------------------------------------------
         1         16         16         16          0  MEMORY LEAK! malloc size <file=foo.f90, var=X, line=7> : MAIN => FOO => BAR
         2         52         48         50          2  MEMORY LEAK! malloc size <file=foo.f90, var=X, line=7> : MAIN => FOO => G => BAR
         1         80         80         80          0  free size <file=foo.f90, var=X, line=10>
         1         80         80         80          0  free size <file=foo.f90, var=X, line=10> : MAIN => FOO => G => BAR
         1        180        180        180          0  free size <file=foo.f90, var=X, line=15>
         1        180        180        180          0  free size <file=foo.f90, var=X, line=15> : MAIN => FOO => BAR
         1        180        180        180          0  malloc size <file=foo.f90, var=X, line=13>
         1        180        180        180          0  malloc size <file=foo.f90, var=X, line=13> : MAIN => FOO => BAR
         4         80         16         49      22.69  malloc size <file=foo.f90, var=X, line=7>
         1         16         16         16          0  malloc size <file=foo.f90, var=X, line=7> : MAIN => FOO => BAR
         3         80         48         60      14.24  malloc size <file=foo.f90, var=X, line=7> : MAIN => FOO => G => BAR
---------------------------------------------------------------------------------------
5. Eclipse TAU Java System
5.1. Installation
Copy the plugins directory in the tau2/tools/src/taujava directory to the location of your eclipse installation. You may have to restart eclipse if it is running when this is done.
In eclipse go to the Window menu, select Preferences and go to the TauJava Preferences section. Enter the location of the lib directory in the tau installation for your architecture in the TAU Library Directory field. Other options may also be selected at this time.
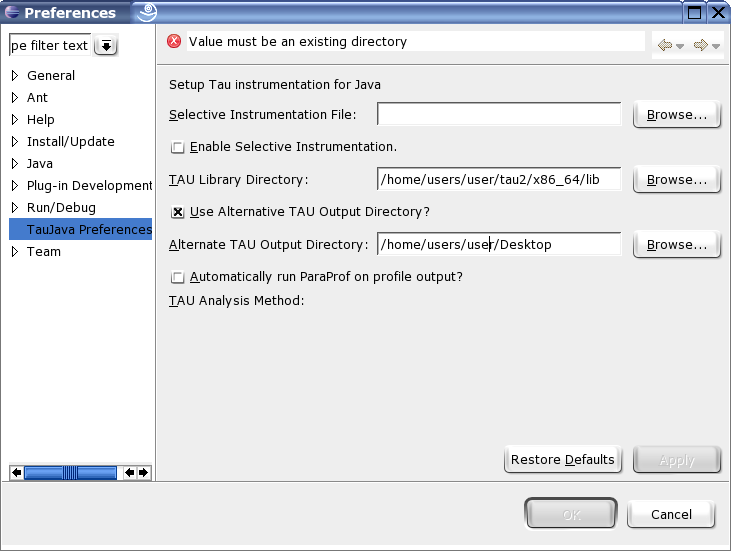
5.2. Instrumentation
Java programs can be instrumented at the level of full Java projects, packages or individual Java files. From within the Java view simply right click on the element in the package explorer that you wish to instrument select the TAU pop up menu and click on Instrument Project, Package or Java respectively.
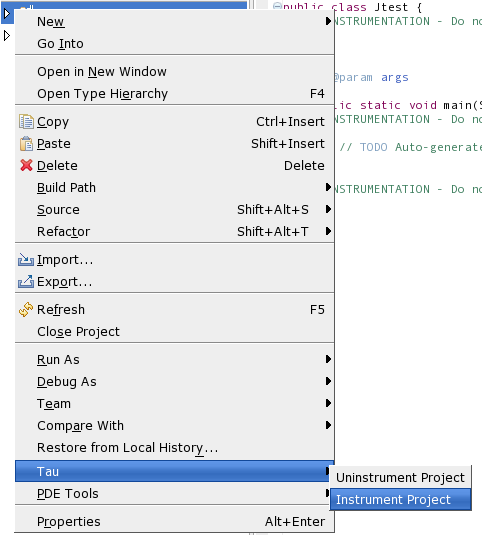
Note that the instrumenter will add the TAU.jar file to the project’s class-path the first time any element is instrumented.
Do not perform multiple instrumentations of the same Java file. Do not edit the comments added by the instrumenter or adjust the white space around them. Doing so may prevent the uninstrumenter from working properly.
5.3. Uninstrumentation
Uninstrumenting a Java project, package or file works just like instrumenting. Just select the uninstrument option instead. Note that the uninstrumenter only removes TAU instrumentation as formatted and commented by the instrumenter. Running the uninstrumenter on code with no TAU instrumentation present has no effect.
5.4. Running Java with TAU
To automatically analyze your instrumented project on a Unix-based system TAU must first be configured with the -JDK option, and any other options you want applied to your trace output. On windows the type of analysis to be conducted, Profile, Call path or Trace, should be selected from the Window, Preferences TauJava Preferences menu.
Once that has been accomplished, right click on the Java file containing the main method you want to run, go to the TAU menu and click on Run TAU-Instrumented Java. The program will run and, by default, the profile and/or trace files will be placed in a timestamped directory, inside a directory indicating the name of the file that was run, in the TAU_Output directory in the home directory of the Java project.
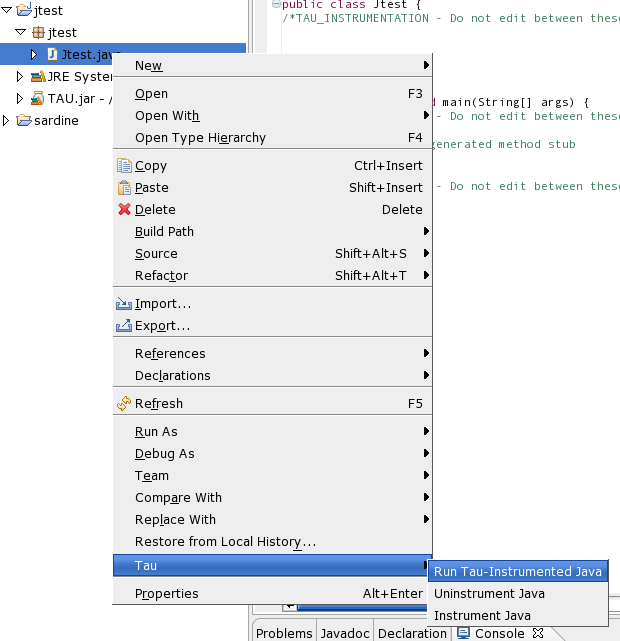
5.5. Options
The following options are accessible from the Window, Preferences TAUJava Preferences menu.
Use Alternative TAU Output Directory: Causes the TAU_Output directory to be placed in the location specified in the associated field. The internal directory structure of the TAU_Output directory remains unchanged.
Automatically run ParaProf on profile output?: Causes the TAU profile viewer, paraprof, to run on the output of profile and call-path analysis output as soon as the trace files have been produced.
Enable selective instrumentation: Causes Java elements specified in the given selection file to be included or excluded from instrumentation. By default all packages files and methods are included. The file should conform to the TAU file selection format described here.
# Any line beginning with a # is a comment and will be disregarded.
#
# If an entry is both included and excluded inclusion will take precedence.
#
# Entries in INCLUDE or EXCLUDE lists may use * as a wildcard character.
#
# If an EXCLUDE_LIST is specified, the methods in the list will not be
# instrumented.
#
BEGIN_EXCLUDE_LIST
*main*
END_EXCLUDE_LIST
#
# If an INCLUDE_LIST is specified, only the methods in the list will be
# instrumented.
#
BEGIN_INCLUDE_LIST
*get*
*set*
END_INCLUDE_LIST
#
# TAU also accepts FILE_INCLUDE/EXCLUDE lists.  These may be specified with
# the wildcard character # to exclude/include multiple files.
# These options may be used in conjunction with the routine INCLUDE/EXCLUDE
# lists as shown above.
#
BEGIN_FILE_INCLUDE_LIST
foo.java
hello#.java
END_FILE_INCLUDE_LIST
#
BEGIN_FILE_EXCLUDE_LIST
bar.java
END_FILE_EXCLUDE_LIST
# Note that the order of the individual sections does not matter
# and not all of the sections need to be included.  Each section
# must be closed.
6. Eclipse PTP / CDT plug-in System
6.1. Installation
Be certain that the PTP / CDT / Photran plug-ins are installed and running properly in your eclipse installation. Use TAU’s perfdmf_configure utility to set up a performance database for Eclipse to store profile output.
Run the install_plug-ins.sh script located in [tau installation]/tools/src/eclipse with the location of your eclipse installation. e.g: ~/tau2/tools/src/eclipse/install_plug-ins.sh /opt/eclipse
Restart eclipse with the -clean flag after installing the plugins.
|
By default Eclipse will detect the presence of TAU on your system and configure itself appropriately so long as the TAU bin directory is in your path. Only if this fails will you need to setup the TAU preferences manually. |
In eclipse go to the Window menu, select Preferences and go to the Performance Tools preferences section and the Tool Configuration subsection. If the PTP is available the Performance Tools section will be under the PTP menu. Enter the location of the desired TAU bin directory in your in the tau Bin Directory field.
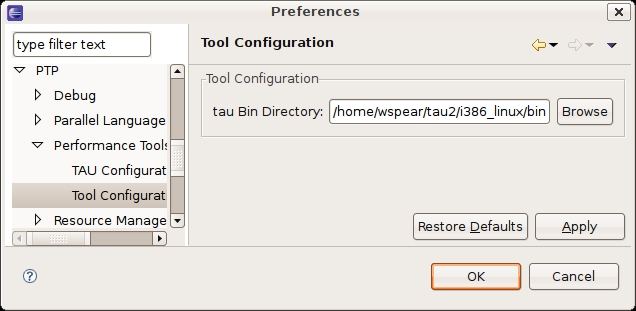
6.2. Creating a TAU Launch Configuration
To create a TAU launch configuration, click the profile button added near the run and debug buttons. This will provide an interface for launching either a standard or parallel C, C++ or Fortran application, similar to the interface provided by the standard run configuration dialog. You may select a pre-existing run configuration or create a new one in the usual way.
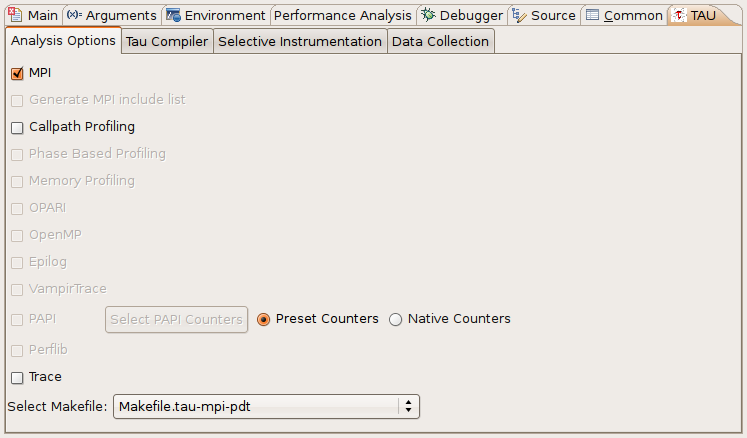
The run configuration options are equivalent to those of a standard run configuration, with the addition of a performance analysis tab a parametric study tab and a TAU tab. To run an application with TAU first make sure that the TAU option is selected in the drop down box on the performance analysis tab. You may also specify that a TAU instrumented executable should not be run after it is built. This option will leave a new TAU specific build configuration available for your use. It will have the name of the original build configuration, with the TAU configuration options used appended. The executables available in such build configurations can be run through the standard run and debug launch configurations. This option can be useful if you need to launch TAU instrumented binaries outside of eclipse. There is also an option to select existing performance data. This will upload data specified on the filesystem to a selected database, rather than generating the data from a project in Eclipse.
On the TAU tab you must select a TAU makefile from the available makefiles in the TAU architecture directory you specified. You may select specific configuration options to narrow the list of makefiles in the dropdown box. Only makefiles configured with the -pdt option will be listed. Additional TAU compiler options are provided on the TAU Compiler sub-tab.
If you select a makefile with the PAPI counter library and -MULTIPLECOUNTERS enabled you may specify the PAPI environment variables using the Select PAPI Counters button. The counters you select will be placed in the environment variables list for your run configuration.
You may specify the use of TAU selective instrumentation either by selecting a pre-defined selective instrumentation file, by selecting the internal option to have TAU to use a file generated by the selective instrumentation commands available in the Eclipse workspace or by selecting the automatic option to have eclipse generate a selective instrumentation file using TAU’s tau_reduce utility. Note that the automatic option will cause your project to be rebuilt and run twice.
By default TAU profile data will only be stored in a perfdmf database, if available. The database may be selected on the Data Collection sub-tab. You may specify that performance data should be kept on the file-system with the Keep Profiles option.
If you wish to collect the resulting profile data on TAU’s online Portal , check the "Upload profile data to TAU Portal" box. After the profiling has finished you will be prompted to provide your user name, password and specify the destination workspace. To view the profile data log on to the portal and select the specified workspace.
6.3. Selective Instrumentation
C, C and Fortran programs have several selective instrumentation options in Eclipse. The selective instrumentation sub-menu of the right click menu provided by C/C and Fortran projects, source files and routines in the C/C++ and program outline views allows inclusion, exclusion and loop level instrumentation to be specified for each of these objects. You may also clear instrumentation specified for each of these levels from the selective instrumentation menu.
The source editor’s context menu allows the insertion of interval and atomic user defined events. To specify an atomic user defined event, place the cursor on the line where you want the event to trigger, right click, go to the Selective Instrumentation sub-menu and select Insert TAU Atomic User Defined Event. Put the name you wish to associate with the event in the first context window that appears. Put either a numeric constant or the name of a valid numeric variable in the second window.
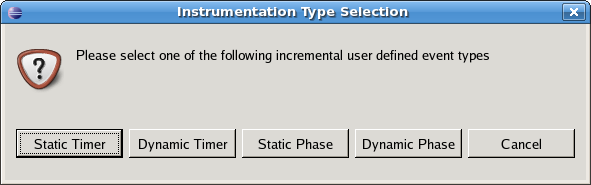
To specify an interval based user defined event, select the source code you wish to be included in the interval, right click, go to the Selective Instrumentation sub-menu and select Insert TAU Interval (start/stop) User Defined Event. You may select use of a Static Timer, Dynamic Timer, Static Phase or Dynamic Phase event. Note that to get phase data you must select a TAU makefile configured with the -PROFILEPHASE option. Once you have selected the event type you will be prompted to enter a name for the event.
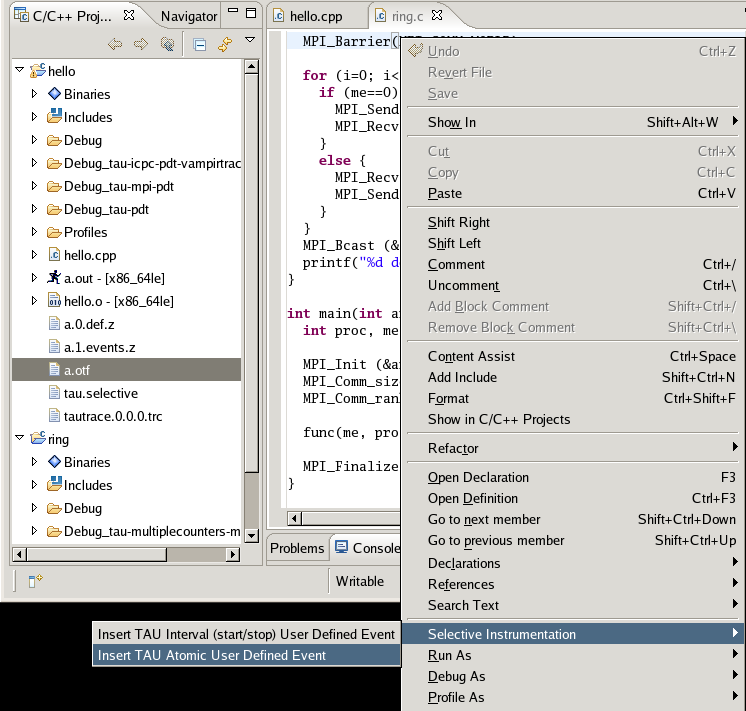
All selective instrumentation options are placed in the tau.selective file in your project’s main directory. This file is automatically employed when the TAU launch configuration has "internal" selective instrumentation selected. You may safely edit this file manually so long as it remains a valid TAU selective instrumentation file.
6.4. Launching a Program and Collecting Data
To launch your project with TAU either select the Profile button from the profile launch configuration window, select your launch configuration from the dropdown menu of the profile button or, if your desired configuration is already selected, simply click on the profile button.
If a perfdmf database is configured and available, TAU profile data will be saved there. Trace data and other performance data output will be stored in your project’s top level directory. If a perfdmf database is not available or you have selected to save profile data on the file system profile output will appear in a Profiles directory in your project’s top level directory. Profiles are organized in sub-directories by the TAU configuration options used to generate them and the time-stamp of their creation.
7. Tools
7.1. tau_compiler.sh
Instrumenting source files.
tau_compiler.sh [<profile>] [-optVerbose] [-optMemDbg] [-optDetectMemoryLeaks] [<dir>] [<opts>] [<opts>] [<opts>] [<opts>] [<opts>] [<opts>] [<parser>] [<parser>] [-optGnuFortranParser] [-optGnuCleanscapeParser] [<opts>] [<path>] [-optContinueBeforeOMP] [-optIncludeMemory] [-optTrackUPCR] [-optTrackDMAPP] [-optTrackPthread] [-optNoTrackGOMP] [-optTrackMPCThread] [-optPreProcess] [<path>] [<options>] [<path>] [<options>] [<options>] [<file>] [<file>] [<opts>] [<opts>] [<opts>] [<opts>] [<opts>] [<opts>] [<opts>] [<opts>] [<cc>] [-optUseReturnFix] [-optLinkOnly] [<path/opari>] [<path>] [<opts>] [<opts>] [<opts>] [<path/opari2>] [<path/opari2_config>] [<path>] [<opts>] [<opts>] [-optOpariNoInit] [-optNoMpi] [-optMpi] [-optNoRevert] [-optRevert] [-optKeepFiles] [-optAppC] [-optAppCXX] [-optAppF90] [-optShared] [-optCompInst] [-optPDTInst] [-optDisableHeaderInst] <compiler> [<compiler_options>] [<filename>]The TAU Compiler provides a simple way to automatically instrument an entire project. The TAU Compiler can be used on C, C++, fixed form Fortran, and free form Fortran.
-optVerbose Turn on verbose debugging messages. -optMemDbg Enable TAU’s runtime memory debugger. -optDetectMemoryLeaks Instructs TAU to detect any memory leaks in C/C programs.TAU then tracks the source location of the memory leak as wellas the place in the callstack where the memory allocation wasmade. `-optPdtDir=<dir>` The PDT architecture directory. Typically `$(PDTDIR)/$(PDTARCHDIR)` . `-optPdtF95Opts=<opts>` Options for Fortran parser in PDT (f95parse). `-optPdtF95Reset=<opts>` Reset options to the Fortran parser to the given list. `-optPdtCOpts=<opts>` Options for C parser in PDT (cparse). Typically `$(TAU_MPI_INCLUDE) $(TAU_INCLUDE) $(TAU_DEFS)` . `-optPdtCReset=<opts>` Reset options to the C parser to the given list `-optPdtCxxOpts=<opts>` Options for C parser in PDT (cxxparse). Typically $(TAU_MPI_INCLUDE) $(TAU_INCLUDE) $(TAU_DEFS) . -optPdtCxxReset=<opts> Reset options to the C parser to the given list `-optPdtF90Parser=<parser>` Specify a different Fortran parser. For e.g., `f90parse` instead of `f95parse` . `-optPdtCxxParser=<parser>` Specify a different C parser. For e.g., cxxparse401 instead of cxxparse . -optGnuFortranParser=<parser> Specify the GNU gfortran Fortran parser gfparse instead of f95parse -optGnuCleanscapeParser Uses the Cleanscape Fortran parser f95parse instead of GNU’s gfparse -optPdtUser=<opts> Optional arguments for parsing source code. -optTauInstr=<path> Specify location of tau_instrumentor. Typically $(TAUROOT)/$(CONFIG_ARCH)/bin/tau_instrumentor . -optContinueBeforeOMP Insert a CONTINUE statement before !$OMP directives. -optIncludeMemory Forinteral use only -optTrackUPCR Adds tracking of the UPC runtime library. -optTrackDMAPP Specify wrapping of Pthread library calls at link time. -optTrackPthread Adds tracking of the UPC runtime library. -optNoTrackGOMP Disable wrapping of GOMP library calls at link time -optTrackMPCThread Specify wrapping of MPC Thread library calls at link time. -optPreProcess Preprocess the source code before parsing. Uses /usr/bin/cpp-P by default. -optCPP=<path> Specify an alternative preprocessor and pre-process the sources. -optCPPOpts=<options> Specify additional options to the C pre-processor. -optCPPReset=<options> ResetC preprocessor options to the specified list. -optFPP=<path> Specify an alternative preprocessor and pre-process for Fortran sources. -optFPPOpts=<options> Specify additional options to the Fortran pre-processor. -optTauSelectFile=<file> Specify selective instrumentation file for tau_instrumentor -optPDBFile=<file> Specify PDB file for tau_instrumentor. Skips parsing stage. -optTau=<opts> Specify options for tau_instrumentor. -optCompile=<opts> Options passed to the compiler. Typically $(TAU_MPI_INCLUDE) $(TAU_INCLUDE) $(TAU_DEFS) . -optTauDefs=<opts> Options passed to the compiler by TAU. Typically $(TAU_DEFS) . -optTauIncludes=<opts> Options passed to the compiler by TAU. Typically $(TAU_MPI_INCLUDE) $(TAU_INCLUDE) . -optReset=<opts> Reset options to the compiler to the given list -optLinking=<opts> Options passed to the linker. Typically $(TAU_MPI_FLIBS) $(TAU_LIBS) $(TAU_CXXLIBS) . -optLinkReset=<opts> Reset options to the linker to the given list. -optLinkPreserveLib=<opts> Libraries which TAU should preserve the order of on the link line see "Moving these libraries to the end of the link line:". Default: none. -optTauCC=<cc> Specifies the C compiler used by TAU. -optUseReturnFix Specifies the use of a bug fix with ROSE parser using EDG v3.x -optLinkOnly Disable instrumentation during compilation, do link in the TAU libs -optOpariTool=<path/opari> Specifies the location of the Opari tool. -optOpariDir=<path> Specifies the location of the Opari directory. -optOpariOpts=<opts> Specifies optional arguments to the Opari tool. -optOpariNoInit Do not initlize the POMP2 regions. -optOpariReset=<opts> Resets options passed to the Opari tool. -optOpariLibs=<> Specifies the libraries that have POMP2 regions. (Overrides optOpariNoInit). -optOpari2Tool=<path to opari2> Specifies the location of the Opari tool. -optOpari2ConfigTool=<path/opari2-config> Specifies the location of the Opari tool configuration file -optOpari2Opts=<opts> Specifies optional arguments to the Opari tool. -optOpari2Reset=<opts> Resets options passed to the Opari tool. -optOpari2Dirs=<opts> Specifies the location of the Opari directory -optNoMpi Removes -l*mpi* libraries during linking (default). -optMpi Does not remove -l*mpi* libraries during linking. -optNoRevert Exit on error. THIS IS CRAZY Does not revert to the original compilation rule on error. -optRevert Revert to the original compilation rule on error (default). -optKeepFiles Does not remove intermediate .pdb and .inst.* files. -optReuseFiles Reuses a pre-instrumented file and preserves them. -optAppCC Sets the failsafe C compiler. -optAppCXX Sets the failsafe C compiler. `-optAppF90` Sets the failsafe F90 compiler `-optShared` Use shared library version of TAU `-optCompInst` Use compiler-based instrumentation `-optNoCompInst` Do not revert to compiler instrumentation if source instrumentation fails. `-optPDTInst` Use PDT-based instrumentation `-optHeaderInst` Enable instrumentation of headers `-optDisableHeaderInst` Disable instrumentation of headers `-optTrackIO` Specify wrapping of POSIX I/O calls at link time. `-optMICOffload` Links code for Intel MIC offloading, requires both host and MIC TAU libraries `-optWrappersDir=""` Specify the location of the link wrappers directory. `-optTauUseCXXForC` Specifies the use of a C compiler for compiling C code -optTauWrapFile=<filename> Specify path to the link_options.tau file generated by tau_wrap -optFixHashIf
7.2. vtf2profile
Generate a TAU profile set from a vampir trace file
vtf2profile [<profile>] [<interval_start>] [-c] [-h] <tracefile>vtf2profile is created when TAU is configured with the -vtf=<vtf_dir> option. This tool converts a VTF trace file (*.vpt) to a tau profile set (profile.A.B.C where A, B and C are the node, context and thread numbers respectively). The vtf file to be read is specified in the command line by the -f flag followed by the file’s location. The VTF tracefile specified may be in gzipped form, eg app.vpt.gz. -p is similarly used to specify the relative path to the directory where the profile files should be stored. If no output directory is specified the current directory will be used. A contiguous interval within the vtf file may be selected for conversion by using the -i flag followed by two integers, representing the timestamp of the start and end of the desired interval respectively. The entire vtf file is converted if no interval is given.
-f tracefile -Specify the Vampir tracefile to be converted. -p profile -Specify the location where the profile file(s) should be written. -i interval_start interval_end -Limit the profile produced to the specified interval within the vampir trace file. -c -Opens a command line interface for the program. -h -Displays a help message.
To convert a vampir tracefile, trace.vpt, to an equivalent TAU profile, use the following: ---- vtf2profile -f trace.vpt To produce a TAU profile in the ./profiles directory representing only the events from the start of the tracefile to timestamp 6000, use: ---- To produce a TAU profile in the ./profiles directory representing only the events from the start of the tracefile to timestamp 6000, use: ---- vtf2profile -f trace.vpt -p ./profiles -i 0 6000 ----
7.3. tau2vtf
convert TAU tracefiles to vampir tracefiles
tau2vtf [-nomessage] [-v] <tau_tracefile> <tau_eventfile> <vtf_tracefile>This program is generated when TAU is configured with the -vtf=<vtf_dir> option. The tau2vtf trace converter takes a single tau_tracefile (.trc) and tau_eventfile (.edf) and produces a corresponding vtf_tracefile (*.vtf). The input files and output file must be specified in that order. Multi-file TAU traces must be merged before conversion. The default output file format is VTF3 binary. If the output filename is given as the .vpt.gz type, rather than .vpt, the output file will be gzipped. There are two additional output format options. The command line argument '-a' produces the vtf file output in ASCII VTF3 format. The command line argument '-fa' produces the vtf file output in the FAST ASCII VTF3 format. Note that these arguments are mutually exclusive.
-nomessage Suppresses printing of message information in the trace. -v Verbose mode sends trace event descriptions to the standard output as they are converted. -a Print the vtf file output in the human-readable VTF3 ASCII format -fa Print the vtf file in the simplified human-readable FAST ASCII VTF3 format
The program must be run with the TAU trace, TAU event and vtf output files specified in the command line in that order. Any additional arguments follow. The following will produce a VTF, app.vpt, from the TAU trace and event files merged.trc and tau.edf trace file: ---- tau2vtf merged.trc tau.edf app.vpt The following will convert merged.trc and tau.edf to a gzipped FAST ASCII vampir tracefile app.vpt.gz, with message events omitted: ---- The following will convert merged.trc and tau.edf to a gzipped FAST ASCII vampir tracefile app.vpt.gz, with message events omitted: ---- tau2vtf merged.trc tau.edf app.vpt.gz -nomessage -fa ----
7.4. trace2profile
convert TAU tracefiles to TAU profile files
tau2vprofile [<directory>] [<snapshot_interval>] <tau_tracefile> <tau_eventfile>This program is generated when TAU is configured with the -TRACE option. The trace2profile converter takes a single tau_tracefile (.trc) and tau_eventfile (.edf) and produces a corresponding series of profile files. The input files must be specified in that order, with optinal parameters coming afterward. Multi-file TAU traces must be merged before conversion.
-d Output profile files to the specified 'directory' rather than the current directory. -s Output a profile snapshot showing the state of the profile data accumulated from the trace every 'snapshot_interval' time units. The snapshot profiles are placed sequentially in directories labled 'snapshot_n' where 'n' is an integer ranging from 0 to to the total number of snapshots -1.
The program must be run with the TAU trace and tau event files specified in the command line in that order. Any additional arguments follow. The following will produce a profile file array, from the TAU trace and event files merged.trc and tau.edf trace file: ---- trace2profile merged.trc tau.edf The following will convert merged.trc and tau.edf to a series of profiles one directory higher. It will also produce a profile snapshot every 250,000 time units: ---- The following will convert merged.trc and tau.edf to a series of profiles one directory higher. It will also produce a profile snapshot every 250,000 time units: ---- trace2profile merged.trc tau.edf -d ./.. -s 250000 ----
vtf2profile , tau2vtf , tau2otf , tau_merge , tau_convert
7.5. tau2elg
convert TAU tracefiles to Epilog tracefiles
tau2elg [-nomessage] [-v] <tau_tracefile> <tau_eventfile> <elg_tracefile>This program is generated when TAU is configured with the -epilog=<epilog_dir> option. The tau2elg trace converter takes a tau trace file (.trc) and event definition file (.edf) and produces a corresponding epilog binary trace file (*.elg). Multi-file TAU traces must be merged before conversion.
-nomessage Suppresses printing of message information in the trace. -v Verbose mode sends trace event descriptions to the standard output as they are converted.
The program must be run with the TAU trace, TAU event and elg output files specified in the command line in that order. Any additional arguments follow. The following would convert merged.trc and tau.edf to the Epilog tracefile app.elg, with message events omitted: ---- ./tau2vtf merged.trc tau.edf app.elg -nomessage ----
7.6. tau2slog2
convert TAU tracefiles to SLOG2 tracefiles
tau2slog2 [options] <tau_tracefile> <tau_eventfile> <output.slog2>This program is generated when TAU is configured with the -slog2 or -slog2=<slog2_dir> option. The tau2slog2 trace converter takes a single tau trace file (.trc) and event definition file (.edf) and produces a corresponding slog2 binary trace file (*.slog2). The tau2slog2 converter is called from the command line with the locations of the tau trace and event files. These arguments must be followed by the -o flag and the name of the slog2 file to be written. tau2slog 2 accepts no other arguments.
[-h|--h|-help|--help] Display HELP message. [-tc] Check increasing endtime order, exit when 1st violation occurs. [-tcc] Check increasing endtime order,continue when violations occur. [-nc number] Number of childern per node (default is 2) [-ls number] Max byte size of leaf nodes (default is 65536) [-o output.slog2] Output filename with slog2 suffix
A typical invocation of the converter, to create app.slog2, is as follows: ---- tau2slog2 app.trc tau.edf -o app.slog2 ----
7.7. tau2otf
convert TAU tracefiles to OTF tracefiles for Vampir/VNG
tau2otf [<streams>] [-nomessage] [-v]This program is generated when TAU is configured with the -otf=<otf_dir> option. The tau2otf trace converter takes a TAU formatted tracefile (.trc) and a TAU event description file (.edf) and produces an output trace file in the Open Trace Format (OTF). The user may specify the number of output streams for OTF. The input files and output file must be specified in that order. TAU traces should be merged using tau_merge prior to conversion.
-n streams Specifies the number of output streams (default is 1). -nomessage Suppresses printing of message information in the trace. -v Verbose mode sends trace event descriptions to the standard output as they are converted.
The program must be run with the tau trace, tau event and otf output files specified in the command line in that order. Any additional arguments follow. The following will produce an OTF file, a pp.otf and other related event and definition files, from the TAU trace and event files merged.trc and tau.edf: ---- tau2otf merged.trc tau.edf app.otf ----
tau2vtf(1), trace2profile(1), vtf2profile(1), tau_merge(1), tau_convert(1)
7.8. tau2otf2
convert TAU tracefiles to OTF2 tracefiles for Vampir/VNG
tau2otf2 [<streams>] [-nomessage] [-v]This program is generated when TAU is configured with the -otf=<otf_dir> option. The tau2otf2 trace converter takes a TAU formatted tracefile (.trc) and a TAU event description file (.edf) and produces an output trace file in the Open Trace Format (OTF2). The user may specify the number of output streams for OTF2. The input files and output file must be specified in that order. TAU traces should be merged using tau_merge prior to conversion.
-n streams Specifies the number of output streams (default is 1). -nomessage Suppresses printing of message information in the trace. -v Verbose mode sends trace event descriptions to the standard output as they are converted.
The program must be run with the tau trace, tau event and otf2 output files specified in the command line in that order. Any additional arguments follow. The following will produce an OTF2 file, a pp.otf2 and other related event and definition files, from the TAU trace and event files tau.trc and tau.edf: ---- tau2otf2 merged.trc tau.edf app.otf2 ----
tau2vtf(1), trace2profile(1), vtf2profile(1), tau_merge(1), tau_convert(1)
7.9. tau_trace2json
convert TAU tracefiles to json tracefiles for Chrome tracing or other viewers
tau_trace2json [<output file>] [-chrome] [-v] [-ignoreatomic] [-nostate] [-nomessage] [-nojson] [-print]The tau_trace2json trace converter takes a TAU formatted tracefile (.trc) and a TAU event description file (.edf) and produces an output trace file in json. The user may specify the creation of a json file readable by Chrome’s trace viewer. If no output file name is specified with the -o option output will be created in an events.json file in the current directory.
-chrome Output Chrome readable trace output. -ignoreatomic Do not include atomic events in json output. TAU traces include metadata as atomic events so using this option is advised in general. -o Specify an output file other than the default events.json -nomessage Suppresses printing of message information in the trace. -v Verbose mode sends trace event descriptions to the standard output as they are converted.
The program must be run with the tau trace, tau event input first followed by any arguments. The following will produce a json file, trace.json, from the TAU trace and event files tau.trc and tau.edf: ---- tau_trace2json ./tau.trc ./tau.edf -chrome -ignoreatomic -o trace.json ----
tau2vtf(1), trace2profile(1), vtf2profile(1), tau_merge(1), tau_convert(1)
7.10. perf2tau
converts PerfLib profiles to TAU profile files
perf2tau <data_directory> [-h] [-flat]Converts perflib data to TAU format. If an argument is not specified, it checks the perf_data_directory environment variable. Then opens perf_data.timing directory to read perflib data If no args are specified, it tries to read perf_data.<current_date> file.
-h Display the help information. -flat Suppresses callpath profiles, each callpath profile will be flattened to show only the function profile.
---- %> perf2tau timing ----
vtf2profile , tau2vtf , tau2otf , tau_merge , tau_convert
7.11. tau_merge
combine multiple node and or thread TAU tracefiles into a merged tracefile
tau_merge [-a] [-r] [-n] [<eventfile_list>] [<output_eventfile>] <tracefile_list>tau_merge is generated when TAU is configured with the -TRACE option. This tool assembles a set of tau trace and event files from multiple multiple nodes or threads across a program’s execution into a single unified trace file. Many TAU trace file tools operate on merged trace files. Minimally, tau_merge must be invoked with a list of unmerged trace files followed by the desired name of the merged trace file or the - flag to send the output to the standard out. Typically the list can be designated by giving the shared name of the trace files to be merged followed by desired range of thread or node designators in brackets or the wild card character '' to encompass variable thread and node designations in the filename (trace.A.B.C.trc where A, B and C are the node, context and thread numbers respectively). For example tautrace..trc would represent all tracefiles in a given directory while tautrace.[0-5].0.0.trc would represent the tracefiles of nodes 0 through 5 with context 0 and thread 0. tau_merge will generate the specified merged trace file and an event definition file, tau.edf by default. The event definition file can be given an alternative name by using the '-m' flag followed by the desired filename. A list of event definition files to be merged can be designated explicitly by using the '-e' flag followed by a list of unmerged .edf files, specified in the same manner as the trace file list. If computational resources are insufficient to merge all trace and event files simultaneously the process may be undertaken hierarchically. Corresponding subsets of the tracefiles and eventfiles may be merged in sequence to produce a smaller set of files that can then be to merged into a singular fully merged tracefile and eventfile. E.g. for a 100 node trace, trace sets 1-10, 11-20, …, 91-100 could be merged into traces 1a, 2a, …, 10a. Then 1a-10a could be merged to create a fully merged tracefile.
-e eventfile_list explicitly define the eventfiles to be merged -m output_eventfile explicitly name the merged eventfile to be created - send the merged tracefile to the standard out -a adjust earliest timestamp time to zero -r do not reassemble long events -n do not block waiting for new events. By default tau_merge will block and wait for new events to be appended if a tracefile is incomplete. This command allows offline merging of (potentially) incomplete tracefiles.
To merge all TAU tracefiles into app.trc and produce a merged tau.edf eventfile: ---- tau_merge .trc app.trc To merge all eventfiles 0-255 into ev0_255merged.edf and TAU tracefiles for nodes 0-255 into the standard out: ---- To merge all eventfiles 0-255 into ev0_255merged.edf and TAU tracefiles for nodes 0-255 into the standard out: ---- tau_merge -e events.[0-255].edf -m ev0_255merged.edf \ tautrace.[0-255]..trc - To merge eventfiles 0, 5 and seven info ev057.edf and tau tracefiles for nodes 0, 5 and 7 with context and thread 0 into app.trc: ---- To merge eventfiles 0, 5 and seven info ev057.edf and tau tracefiles for nodes 0, 5 and 7 with context and thread 0 into app.trc: ---- tau_merge -e events.0.edf events.5.edf events.7.edf -m ev057.edf \ tautrace.0.0.0.trc tautrace.5.0.0.trc tautrace.7.0.0.trc app.trc ----
7.12. tau_treemerge.pl
combine multiple node and or thread TAU tracefiles into a merged tracefile
tau_treemerge.pl [<break_amount>]tau_treemerge.pl is generated when TAU is configured with the -TRACE option. This tool assembles a set of tau trace and event files from multiple multiple nodes or threads across a program’s execution into a single unified trace file. Many TAU trace file tools operate on merged trace files. tau_treemerge.pl will generate the specified merged trace file and an event definition file, tau.edf by default.
-n break_amount set the maximum number of trace files to merge in each invocation of tau_merge. If we need to merge 2000 trace files and if the maximum number of open files specified by unix is 250, tau_treemerge.pl will incrementally merge the trace files so as not to exceed the number of open file descriptors.
tau_merge tau_convert trace2profile tau2vtf tau2elg tau2slog2
7.13. tau_convert
convert TAU tracefiles into various alternative trace formats
tau_convert [<outputtrc>] <inputtrc> <edffile>tau_convert is generated when TAU is configured with the -TRACE option. This program requires specification of a TAU tracefile and eventfile. It will convert the given TAU traces to the ASCII-based trace format specified in the first argument. The conversion type specification may be followed by additional options specific to the conversion type. It defaults to the single threaded vampir format if no other format is specified. tau_convert also accepts specification of an output file as the last argument. If none is given it prints the converted data to the standard out.
-alog convert TAU tracefile into the alog format (This format is deprecated. The SLOG2 format is recommended.) -SDDF convert TAU tracefile into the SDDF format -dump convert TAU tracefile into multi-column human readable text -paraver convert TAU tracefile into paraver format -t indicate conversion of multi threaded TAU trace into paraver format -pv convert single threaded TAU tracefile into vampir format (all -vampir options apply) (default) -vampir convert multi threaded TAU tracefile into vampir format -longsymbolbugfix make the first characters of long, similar identifier strings unique to avoid a bug in vampir -compact abbreviate individual event entries -all compact all entries (default) -user compact user entries only -class compact class entries only -nocomm disregard communication events [outputtrc] specify the name of the output tracefile to be produced
To print the contents of a TAU tracefile to the screen: ---- tau_convert -dump app.trc tau.edf To convert a merged, threaded TAU tracefile to paraver format: ---- To convert a merged, threaded TAU tracefile to paraver format: ---- tau_convert -paraver -t app.trc tau.edf app.pv ----
7.14. tau_reduce
generates selective instrumentation rules based on profile data
tau_reduce <filename> [-n] [<filename>] [<filename>] [-v] [-p]tau_reduce is an application that will apply a set of user-defined rules to a pprof dump file ( pprof -d ) in order to create a select file that will include an exclude list for selective implementation for TAU. The user must specify the name of the pprof dump file that this application will use. This is done with the -f filename flag. If no rule file is specified, then a single default rule will be applied to the file. This rule is: numcalls > 1000000 & usecs/call < 2, which will exclude all routines that are called at least 1,000,000 times and average less then two microseconds per call. If a rule file is specified, then this rule is not applied. If no output file is specified, then the results will be printed out to the screen.
Users can specify a set of rules for tau_reduce to apply. The rules should be specified in a separate file, one rule per line, and the file name should be specifed with the appropriate option on the command line. The grammar for a rule is: [GROUPNAME:]FIELD OPERATOR NUMBER. The GROUPNAME followed by the colon (:) is optional. If included, the rule will only be applied to routines that are a member of the group specified. Only one group name can be applied to each rule, and a rule must follow a groupname. If only a groupname is given, then an unrecognized field error will be returned. If the desired effect is to exclude all routines that belong to a certain group, then a trivial rule, such as GROUP:numcalls > -1 may be applied. If a groupnameis given, but the data does not contain any groupname data, then then an error message will be given, but the rule will still be applied to the date ignoring the groupname specification. A FIELD is any of the routine attributes listed in the following table:
ATTRIBUTE NAME     MEANING
numcalls           Number of times the routine is called
numsubrs           Number of subroutines that the routine contains
percent            Percent of total implementation time
usec               Exclusive routine running time, in microseconds
cumusec            Inclusive routine running time, in microseconds
count              Exclusive hardware count
totalcount         Inclusive hardware count
stddev             Standard deviation
usecs/call         Microseconds per call
counts/call        Hardware counts per call
| ATTRIBUTE NAME | MEANING |
|---|---|
numcalls |
Number of times the routine is called |
numsubrs |
Number of subroutines that the routine contains |
percent |
Percent of total implementation time |
usec |
Exclusive routine running time, in microseconds |
cumusec |
Inclusive routine running time, in microseconds |
count |
Exclusive hardware count |
totalcount |
Inclusive hardware count |
stddev |
Standard deviation |
usecs/call |
Microseconds per call |
counts/call |
Hardware counts per call |
Some FIELDS are only available for certain files. If hardware counters are used, then usec, cumusec, usecs/per call are not applicable and a error is reported. The opposite is true if timing data is used rather than hardware counters. Also, stddev is only available for certain files that contain that data. An OPERATOR is any of the following: < (less than), > (greater than), or = (equals). A NUMBER is any number. A compound rule may be formed by using the & (and) symbol in between two simple rules. There is no "OR" because there is an implied or between two separate simple rules, each on a separate line. (ie the compound rule usec < 1000 OR numcalls = 1 is the same as the two simple rules "usec < 1000" and "numcalls = 1").
#exclude all routines that are members of TAU_USER and have less than
#1000 microseconds
TAU_USER:usec < 1000

#exclude all routines that have less than 1000 microseconds and are
#called only once.
usec < 1000 & numcalls = 1

#exclude all routines that have less than 1000 usecs per call OR have a percent
#less than 5
usecs/call < 1000
percent < 5
| Any line in the rule file that begins with a # is a comment line. For clarity, blank lines may be inserted in between rules and will also be ignored. |
-f filename specify filename of pprof dump file -p print out all functions with their attributes -o filename specify filename for select file output (default: print to screen -r filename specify filename for rule file -v verbose mode (for each rule, print out rule and all functions that it excludes)
To print to the screen the selective instrumentation list for the paraprof dump file app.prf with default selection rules use: ---- tau_reduce -f app.prf To create a selection file, app.sel, from the paraprof dump file app.prf using rules specified in foo.rlf use: ---- To create a selection file, app.sel, from the paraprof dump file app.prf using rules specified in foo.rlf use: ---- tau_reduce -f app.prf -r foo.rlf -o app.sel ----
7.15. tau_ompcheck
Completes uncompleted do/for/parallel omp directives
tau_ompcheck <pdbfile> <sourcefile> [<outfile>] [-v] [-d]Finds uncompleted do/for omp directives and inserts closing directives for each one uncompleted. do/for directives are expected immediately before a do/for loop. Closing directives are then placed immediately following the same do/for loop.
pdbfile A pdbfile generated from the source file you wish to check. This pdbfile must contain comments from which the omp directives are gathered. See pdbcomment for information on how to obtain comment from a pdbfile. sourcefile A fortran, C or C++ source file to analyzed. -o write the output to the specified outfile. -v verbose output, will say which directive where added. -d debuging information, we suggest you pipe this unrestrained output to a file.
To check file: source.f90 do: (you will need pdtoolkit/<arch>/bin and tau/utils/ in your path). ---- %>f95parse source.f90 %>pdbcomment source.pdb > source.comment.pdb %>tau_omp source.comment.pdb source.f90 -o source.chk.f90 ----
f95parse pdbcomment
7.16. tau_poe
Instruments a MPI application while it is being executed with poe.
tau_poe [<tauOptions>] <applcation> [<poe options>]This tool dynamically instruments a mpi application by loading a specific mpi library file.
tauOptions To instrument a mpi application a specific TAU library file is loaded when the application is executed. To select which library is loaded use this option. The library files are build according to the options set when TAU is configured. The library file that have been build and thus available for use are in the [TAU_HOME]/[arch]/lib directory. The file are listed as libTAUsh-*.so where * is the instrumentation options. For example to use the libTAUsh-pdt-openmp-opari.so file let the comman line option be -XrunTAUsh-pdt-openmp-opari.
Instrument a.out wit the currently configured options and then run it on four nodes: ---- %>tau_poe ./a.out -procs 4 ---- Select the libTAUsh-mpi.so library to instrument a.out with: ---- %>tau_poe -XrunTAUsh-mpi ./a.out -procs 4 ----
7.17. tau_validate
Validates a TAU installation by performing various tests on each TAU stub Makefile
tau_validate [-v] [--html] [--build] [--run] [--tag] <arch directory>tau_validate will attempt to validate a TAU installation by performing various tests on each TAU stub Makefile. Some degree of logic exists to know where a given test applies to a given makefile, but it’s not perfect.
v Verbose output html Output results in HTML build Only build run Only run tag Only check configurations containing the tag. ie. --tag papi checks only libraries with the -papi in their name. arch directory Specify an arch directory (e.g. rs6000), or the lib directory (rs6000/lib), or a specific makefile. Relative or absolute paths are ok.
There is a few examples: ---- bash : ./tau_validate --html x86_64 &> results.html tcsh : ./tau_validate --html x86_64 >& results.html ----
7.18. tauex
Allows you to choose a TAU configuration at runtime
tauex <OPTION> -- <executable> [<executable options>]Use this script to dynamically load a TAU profiling/tracing library or to select which papi events/domain to use during execuation of the application. At runtime tauex will set the LD_LIBRARY_PATH and pass any other parameters (or papi events) to the program and execute it with the specified TAU measurement options.
| -d |
Enable debugging output, use repeatedly for more output. |
| -h |
Print help message. |
| -i |
Print information about the host machine. |
| -s |
Dump the shell environment variables and exit. |
| -U |
User mode counts |
| -K |
Kernel mode counts |
| -S |
Supervisor mode counts |
| -I |
Interrupt mode counts |
| -l |
List events |
| -L <event> |
Describe event |
| -a |
Count all native events (implies -m) |
| -n |
Multiple runs (enough runs of exe to gather all events) |
| -e <event> |
Specify PAPI preset or native event |
| -T <option> |
Specify TAU option |
| -v |
Debug/Verbose mode |
| -XrunTAU-<options> |
specify TAU library directly |
Defaults if unspecified: -U -T MPI,PROFILE -e P_WALL_CLOCK_TIME MPI is assumed unless SERIAL is specified PROFILE is assumed unless one of TRACE, VAMPIRTRACE or EPILOG is specified P_WALL_CLOCK_TIME means count real time using fastest available timer
mpirun -np 2 tauex -e PAPI_TOT_CYC -e PAPI_FP_OPS -T MPI,PROFILE — ./ring
7.19. tau_exec
TAU execution wrapping script
tau_exec <options> -- <exe> [<exe options>]Use this script to perform runtime performance tracking on either an instrumented or uninstrumented executable. Options include memory and IO tracking, event based sampling, hardware accelerator tracking and data collection from library-provided instrumention API’s such as mpi communication events and RAJA and Kokkos instrumention hooks.
| -v |
verbose mode |
| -s |
show the command generated by tau_exec without running it |
| -qsub |
BG/P qsub mode |
| -io |
track io |
| -memory |
track memory |
| -memory |
enable memory debugger |
| -cuda |
track GPU events via CUDA (Must be configured with -cuda=<dir>, Preferred of CUDA 4.0 or earlier) |
| -cupti |
track GPU events via Nvidia’s CUPTI interface (Must be configured with -cupti=<dir>, Preferred for CUDA 4.1 or later). |
| -cupti_pc |
track pc sampling events through cupti. Mutually exclusive with the -cupti option. Control hardware buffer size and sampling period with TAU_CUPTI_PC_HWB and TAU_CUPTI_PC_PERIOD environment variables. Generates CUBIN files which may be deleted. Compile application with -lineinfo or -G to make source lines available for PC samples. |
| -nccl |
track NCCL events using the NCCL performance plugin API |
| -um |
in conjunction with -cupti adds support for the Unified Memory GPUs. Requires CUDA 6.5 or later. |
| -opencl |
track GPU events via OpenCL |
| -openacc |
track openacc events. Supports TAU configurations with -arch=craycnl or PGI compilers on x86_64 Linux |
| -ompt |
track OpenMP events via OMPT interface |
| -power |
track power events via PAPI’s perf RAPL interface |
| -numa |
track DRAM events. Requires PAPI with recent perf support for x86_64 |
| -armci |
track ARMCI events via PARMCI (Must be configured with -armci=<dir>) |
| -shmem |
track SHMEM events |
| -numa |
Activates hardware counters to measure remote DRAM accesses and total node accesses. These counters must be available from PAPI in the selected TAU configuration. |
| -ts-sample-flags=<flags> |
flags to pass to PT TS sample_ts command. Overrides TAU_TS_SAMPLE_FLAGS env. var. |
| -ts-report-flags=<flags> |
flags to pass to PT TS report_ts command. Overrides TAU_TS_REPORT_FLAGS env. var. |
| -ebs |
enable Event-based sampling to capture runtime event profiles without instrumentation. See README.sampling for more information |
| -ebs_period=<count > |
sampling period (default 1000) |
| -ebs_source=<counter> |
sets sampling metric (default "itimer") |
| -ebs_resolution=<file|function|line> |
sets sampling granularity (default "function") |
| -syscall |
track SYSCALL |
| -ptts |
Launch ThreadSpotter. It must be available in the system path. |
| -um |
enable Unified Memory events via CUPTI |
| -sass=<level> |
tracks GPU events via CUDA with source code locator activity |
| -csv |
output sass profile in CSV format |
| -T<option> |
: specify TAU option |
| -loadlib=<file.so > |
: specify additional load library |
| -XrunTAU-<options> |
specify TAU library directly |
| -gdb |
run program in gdb debugger |
| -rocm |
capture events and metadata from the ROCm performance API |
| -rocm_pc |
captures the events provided by -rocm along with PC sampling from the ROCm api, tries to set stochastic, if not available, uses host trap |
| -rocm_pc_host |
captures the events provided by -rocm along with PC sampling from the ROCm api, forces host trap sampling |
| -rocm_pc_stoc |
captures the events provided by -rocm along with PC sampling from the ROCm api, forces stochastic sampling |
| -tau_ebs_resolution=<file|function|line> |
process sampled events at the file/function/line level depending on the given argument. line is the default. the environment variable TAU_EBS_RESOLUTION can be set to one of these options to achieve the same effect. |
| -ittnotify |
Track Intel ITTNotify tasks. |
| -monitoring |
monitors hardware counters and other commands by polling periodically as specified in a tau_monitoring.json file included in the run directory. Example: |
| -l0 |
captures events and metadata from the Level Zero performance API |
| -l0_pc |
track pc sampling events through level zero API. Control sampling interval in microseconds with TAU_L0_SAMPLING_INTERVAL environmental variable. |
{
  "periodic": true,
  "periodicity seconds": 1.0,
  "/proc/stat": {
    "comment": "This will exclude all core-specific readings.",
    "exclude": ["^cpu[0-9]+.*"]
  },
  "/proc/meminfo": {
    "comment": "This will include three readings.",
    "include": [".*MemAvailable.*", ".*MemFree.*", ".*MemTotal.*"]
  },
  "/proc/net/dev": {
    "disable": true,
    "comment": "This will include only the first ethernet device.",
    "include": [".*eno1.*"]
  },
  "lmsensors": {
    "disable": true,
    "comment": "This will include all power readings.",
    "include": [".*power.*"]
  },
  "net": {
    "disable": true,
    "comment": "This will include only the first ethernet device.",
    "include": [".*eno1.*"]
  },
  "nvml": {
    "disable": false,
    "comment": "This will include only the utilization metrics.",
    "include": [".*utilization.*"]
  }
Defaults if unspecified: -T MPI. MPI is assumed unless SERIAL is specified CUDA kernel tracking is included, if A CUDA SYNC call is made after each kernel launch and cudaThreadExit() is called before the exit of each thread that uses CUDA. OPENCL kernel tracking is included, if A OPENCL SYNC call is made after each kernel launch and clReleaseContext() is called before the exit of each thread that uses CUDA. tau_python is similar to tau_exec and can replace the 'python' command when launching a python application. The -tau_python_interpreter=<interpreter> argument allows specification of a python interpreter other than the one used to configure TAU.
mpirun -np 2 tau_exec -io ./ring mpirun -np 8 tau_exec -ebs -ebs_period=1000000 -ebs_source=PAPI_FP_INS ./ring tau_exec -T serial,cupti -cupti ./matmult (Preferred for CUDA 4.1 or later) tau_exec -T serial -cuda ./matmult (Preferred for CUDA 4.0 or earlier) tau_exec -T serial -opencl (OPENCL)
7.20. tau_timecorrect
Corrects and reorders the records of TAU trace files.
tau_timecorrect <trace input file> <EDF input file> <trace output file> <EDF input file>This program takes in TAU trace files, reorders and corrects the times of these records and then outputs the records to new trace files. The time correction algorithm uses a logical clock algorithm with amortization. This is done by adjusting the times of events such that the product of an effect happens after the cause of that effect.
trace input file EDF input file trace output file EDF output file
7.21. tau_throttle.sh
This tool generates a selective instrumentation file (called throttle.tau) from a program output that has "Disabling" messages.
tau_throttle.shThis tools will auto-generates a selective instrumenation file basied on output from a program that has the profiling of some its functions throttled.
7.22. tau_portal.py
This tool is design to interact with the TAU web portal (http://tau.nic.uoregon.edu). There are commands for uploading or downloading packed profile files form the TAU portal.
tau_portal.py [-help] [--help] <command> <options> [<argument>]Each command will initate a transfer to profile data btween the TAU portal and either the filesytem (to be stored as ppk file) or to a PerfDMF database. See tau_portal --help for more information.
7.23. taudb_configure
Configuration program for a PerfDMF database.
taudb_configure [-h,--help] [--create-default] [<configFile>] [<configuration_name>] [<path>]This configuration script will create a new TAUdb database.
-h, --help show help --create-default creates a H2 database with all the default values -g, --configFile configFile specify the path to the file that defines the TAUdb configuration. -c, --config configuration_name specify the name of the TAUdb configuration -c foo is equalivent to -g <home>/.ParaProf/perfdmf.cfg.foo . -t, --tauroot path Path to the root directory of tau.
7.24. perfdmf_createapp
perfdmf_createapp [-h, --help] [<configFile>] [<configuration_name>] [<applicationID>] <name>This script will create a new application in the perfdmf database.
-g, --configFile configFile specify the path to the file that defines the perfdmf configuration. -c, --config configuration_name specify the name of the perfdmf configuration -c foo is equalivent to -g <home>/.ParaProf/perfdmf.cfg.foo . -a, --applicationid applicationID specify the id number of the newly added application (default uses auto-increment). -n, --name name the name of the application.
7.25. perfdmf_createexp
perfdmf_createexp [-h, --help] [<configFile>] [<configuration_name>] <applicationID> <name>This script will create a new experiment in the perfdmf database.
-g, --configFile configFile specify the path to the file that defines the perfdmf configuration. -c, --config configuration_name specify the name of the perfdmf configuration -c foo is equalivent to -g <home>/.ParaProf/perfdmf.cfg.foo. -a, --applicationid applicationID specify the id number of the application to associate with the new experiment. -n, --name name the name of the application.
7.26. taudb_loadtrial
Command line tool to load a trial into the TAUdb database.
taudb_loadtrial <appName> <experimentName> <name> [options]This script will create a new trial in the TAUdb database.
-n, --name name the name of the application. -a, --applicationname name specify associated application name for this trial -x, --experimentname experimentName specify the name of the experiment to associate with newly uploaded trial. -e, --experimentid experimentID specify the id number of the experiment to associate with the new trial. -g, --configFile configFile specify the path to the file that defines the TAUdb configuration. (overrides -c) -c, --config configuration_name specify the name of the TAUdb configuration -c foo is equalivent to -g <. -t, --trialid experimentID specify the id number of the newly uploaded trial. -m, --metadata filename specify the filename of the XML metadata for this trial. -f, --filetype filetype Specify type of performance data, options are: profiles (default), pprof, dynaprof, mpip, gprof, psrun, hpm, packed, cube, hpc, ompp, snap, perixml, gptl, paraver, ipm, google -i, --fixnames Use the fixnames option for gprof
For the TAU profiles type, you can specify either a specific set of profile files on the commandline, or you can specify a directory (by default the current directory). The specified directory will be searched for profile...* files, or, in the case of multiple counters, directories named MULTI_* containing profile data.
taudb_loadtrial -e 12 -n "Batch 001" This will load profile.* (or multiple counters directories MULTI_*) into experiment 12 and give the trial the name "Batch 001" taudb_loadtrial -e 12 -n "HPM data 01" -f hpm perfhpm* This will load perfhpm* files of type HPMToolkit into experiment 12 and give the trial the name "HPM data 01" taudb_loadtrial -a "NPB2.3" -x "parametric" -n "64" par64.ppk This will load packed profile par64.ppk into the experiment named "parametric" under the application named "NPB2.3" and give the trial the name "64". The application and experiment will be created if not found.
7.27. perfexplorer
Launches TAU’s Performance Data Mining Analyzer.
perfexplorer [-n, --nogui] [<script>]Complete documentation can be found at http://www.cs.uoregon.edu/research/tau/tau-usersguide.pdf
7.28. perfexplorer_configure
Configures a TAUdb database for use with perfexplorer, and installs necessary JAR files.
perfexplorer_configureConfigures a TAUdb database for use with perfexplorer, and installs necessary JAR files.
7.29. taucc
C compiler wrapper for TAU
taucc [options] ...
-tau:help
|
Displays help |
-tau:verbose
|
Enable verbose mode |
-tau:keepfiles
|
Keep intermediate files |
-tau:show
|
Do not invoke, just show what would be done |
-tau:pdtinst
|
Use PDT instrumentation |
-tau:compinst
|
Use compiler instrumentation |
-tau:headerinst
|
Instrument headers |
-tau:<options>
|
Specify measurement/instrumentation options. Sample options: mpi,pthread,openmp,profile,callpath,trace,vampirtrace,epilog |
-tau:makefile tau_stub_makefile
|
Specify tau stub makefile |
If the -tau:makefile option is not used, the TAU_MAKEFILE environment variable will be checked, if it is not specified, then the -tau:<options> will be used to identify a binding.
taucc foo.c -o foo taucc -tau:MPI,OPENMP,TRACE foo.c -o foo taucc -tau:verbose -tau:PTHREAD foo.c -o foo
Complete documentation can be found at http://www.cs.uoregon.edu/research/tau/tau-usersguide.pdf
7.30. tauupc
UPC wrapper for TAU
tauupc [options] ...
-tau:help
|
Displays help |
-tau:verbose
|
Enable verbose mode |
-tau:keepfiles
|
Keep intermediate files |
-tau:show
|
Do not invoke, just show what would be done |
-tau:pdtinst
|
Use PDT instrumentation |
-tau:compinst
|
Use compiler instrumentation |
-tau:headerinst
|
Instrument headers |
-tau:<options>
|
Specify measurement/instrumentation options. Sample options: mpi,pthread,openmp,profile,callpath,trace,vampirtrace,epilog |
-tau:makefile tau_stub_makefile
|
Specify tau stub makefile |
If the -tau:makefile option is not used, the TAU_MAKEFILE environment variable will be checked, if it is not specified, then the -tau:<options> will be used to identify a binding.
Complete documentation can be found at http://www.cs.uoregon.edu/research/tau/tau-usersguide.pdf
7.31. taucxx
C++ compiler wrapper for TAU
taucxx [options] ...
-tau:help
|
Displays help |
-tau:verbose
|
Enable verbose mode |
-tau:keepfiles
|
Keep intermediate files |
-tau:show
|
Do not invoke, just show what would be done |
-tau:pdtinst
|
Use PDT instrumentation |
-tau:compinst
|
Use compiler instrumentation |
-tau:headerinst
|
Instrument headers |
-tau:<options>
|
Specify measurement/instrumentation options. Sample options: mpi,pthread,openmp,profile,callpath,trace,vampirtrace,epilog |
-tau:makefile tau_stub_makefile
|
Specify tau stub makefile |
If the -tau:makefile option is not used, the TAU_MAKEFILE environment variable will be checked, if it is not specified, then the -tau:<options> will be used to identify a binding.
taucxx foo.cpp -o foo taucxx -tau:MPI,OPENMP,TRACE foo.cpp -o foo taucxx -tau:verbose -tau:PTHREAD foo.cpp -o foo
Complete documentation can be found at http://www.cs.uoregon.edu/research/tau/tau-usersguide.pdf
7.32. tauf90
Fortran compiler wrapper for TAU
tauf90 [options] ...
-tau:help
|
Displays help |
-tau:verbose
|
Enable verbose mode |
-tau:keepfiles
|
Keep intermediate files |
-tau:show
|
Do not invoke, just show what would be done |
-tau:pdtinst
|
Use PDT instrumentation |
-tau:compinst
|
Use compiler instrumentation |
-tau:headerinst
|
Instrument headers |
-tau:<options>
|
Specify measurement/instrumentation options. Sample options: mpi,pthread,openmp,profile,callpath,trace,vampirtrace,epilog |
-tau:makefile tau_stub_makefile
|
Specify tau stub makefile |
If the -tau:makefile option is not used, the TAU_MAKEFILE environment variable will be checked, if it is not specified, then the -tau:<options> will be used to identify a binding.
tauf90 foo.f90 -o foo tauf90 -tau:MPI,OPENMP,TRACE foo.f90 -o foo tauf90 -tau:verbose -tau:PTHREAD foo.f90 -o foo
Complete documentation can be found at http://www.cs.uoregon.edu/research/tau/tau-usersguide.pdf
7.33. paraprof
Launches TAU’s Java-based performance data viewer.
paraprof [-h, --help] [<filetype>] [<file>] [--dump] [-o, --oss] [-s, --summary]For the TAU profiles type, you can specify either a specific set of profile files on the commandline, or you can specify a directory (by default the current directory). The specified directory will be searched for profile...* files, or, in the case of multiple counters, directories named MULTI_* containing profile data.
-h
|
Display help |
-f, --filetype filetype
|
Specify type of performance data. Options are: profiles (default), pprof, dynaprof, mpip, gprof, psrun, hpm, packed, cube, hpc, ompp, snap, perixml, gptl |
--pack file
|
Pack the data into packed (.ppk) format (does not launch ParaProf GUI) |
--dump
|
Dump profile data to TAU profile format (does not launch ParaProf GUI). |
-o, --oss
|
Print profile data in OSS style text output |
-s, --summary
|
Print only summary statistics (only applies to OSS output) |
Complete documentation can be found at http://www.cs.uoregon.edu/research/tau/tau-usersguide.pdf
7.34. pprof
Quickly diplays profile data.
pprof [-a] [-c] [-b] [-m] [-t] [-e] [-i] [-v] [-r] [-s] [<num>] [<filename>] [-p] [-l] [-d]-a Show all location information available -c Sort according to number of Calls -b Sort according to number of suBroutines called by a function -m Sort according to Milliseconds (exclusive time total) -t Sort according to Total milliseconds (inclusive time total) (default) -e Sort according to Exclusive time per call (msec/call) -i Sort according to Inclusive time per call (total msec/call) -v Sort according to Standard Deviation (excl usec) -r Reverse sorting order -s print only Summary profile information -n num print only first num number of functions -f filename specify full path and Filename without node ids -p suPpress conversion to hhmmssmmm format -l List all functions and exit -d Dump output format (for tau_reduce) [node numbers] prints only info about all contexts/threads of given node numbers
7.35. tau_instrumentor
automaticly instruments a source basied on information provided by pdt.
tau_instrumentor [--help] <pdbfile> <sourcefile> [-c] [-b] [-m] [-t] [-e] [-i] [-v] [-r] [-s] [<num>] [<filename>] [-p] [-l] [-d]-a Show all location information available -c Sort according to number of Calls -b Sort according to number of suBroutines called by a function -m Sort according to Milliseconds (exclusive time total) -t Sort according to Total milliseconds (inclusive time total) (default) -e Sort according to Exclusive time per call (msec/call) -i Sort according to Inclusive time per call (total msec/call) -v Sort according to Standard Deviation (excl usec) -r Reverse sorting order -s print only Summary profile information -n num print only first num number of functions -f filename specify full path and Filename without node ids -p suPpress conversion to hhmmssmmm format -l List all functions and exit -d Dump output format (for tau_reduce) [node numbers] prints only info about all contexts/threads of given node numbers
%> tau_instrumentor foo.pdb foo.cpp -o foo.inst.cpp -f select.tau
7.36. vtfconverter
vtfconverter [-h] [-c] [<file>] [<path>] [<from>]Converts VTF profile to TAU profiles and launches an interactive VTF prompt.
-c Opens command line interface. -f Converts trace [file] to TAU profiles. -p Places the resulting profiles in the directory [path]. -i States that the interval [from],[to] should be profiled.
7.37. tau_setup
Launches GUI interface to configure TAU.
tau_setup-v Verbose output. --html Output results in HTML. --build Only build. --run Only run.
7.38. tau_wrap
Instruments an external library with TAU without needing to recompile
tau_wrap <pdbfile> <sourcefile> [<outputfile>] [<groupname>] [<headerfile>] [<selectivefile>]| pdbfile |
A pdb file generated by cparse, cxxparse, or f90parse; these commands are found in the [PDT_HOME]/[arch]/bin directory. |
| sourcefile |
The source file corresponding to the pdbfile. |
| -o outputfile |
The filename of the resulting instrumented source file. |
| -g groupname |
This associates all the functions profiled as belonging to the this group. Once profiled you will be able to analysis these functions separately. |
| -i headerfile |
By default |
| -f selectivefile |
You can specify a selective instrumentation file that defines how the source file is to be instrumented. |
---- %> tau_wrap hdf5.h.pdb hdf5.h -o hdf5.inst.c -f select.tau -g hdf5 ---- This specifies the instrumented wrapper library source (hdf5.inst.c), the instrumentation specification file (select.tau) and the group (hdf5). It creates the wrapper/ directory.
7.39. tau_gen_wrapper
Generates a wrapper library that can intercept at link time or at runtime routines specified in a header file
tau_gen_wrapper <headerfile> <library> [-w | -d | -r]| headerfile |
Name of the headerfile to be wrapped |
| library |
Name of the library to wrap |
| -w |
(default) generates wrappers for re-linking the application |
| -d |
generates wrappers by redefining routines during compilation in header files |
| -r |
generates wrappers that may be pre-loaded using tau_exec at runtime |
---- %> tau_gen_wrapper hdf5.h /usr/lib/libhdf5.a ---- This generates a wrapper library that may be linked in using TAU_OPTIONS -optTauWrapFile=<wrapperdir>/link_options.tau
tau_gen_wrapper reads the TAU_MAKEFILE environment variable to get PDT settings
7.40. tau_pin
Instruments application at run time using Intel’s PIN library
tau_pin [<proc_num>] [<rules>] -- [<myapp>] [<myargs>]
-n proc_num
|
This argument enables multple instances of MPI applications launched with MPIEXEC. proc_num is the parameter indicating number of MPI process instances to be launched. This argument is optional and one can profile MPI application even with single process instance without this argument. |
-r rule
|
This argument is specification rule for profiling the application. It allows selective profiling by specifying the "rule". The rule is a wildcard expression token which will indicate the area of profiling. It can be only the routine specification like "" which indicates it’ll instrument all the routines in the EXE or MPI routines. One can further specify the routines on a particular dll by the rule "somedll.dll!". The dll name can also be in regular expression. We treat the application exe and MPI routines as special cases and specifying only the routines is allowed. |
myapp
|
It’s the application exe. This application can be Windows or console application. Profiling large Windows applications might suffer from degraded performance and interactability. Specifying a limited number of interesting routines can help. |
myargs
|
It’s the command line arguments of the application. |
To profile routines in mytest.exe with prefix "myf": ---- tau_pin -r myf.* — mytest.exe ---- To profile all routines in mpitest.exe ( no need to specify any rule for all ): ---- tau_pin mpitest.exe ---- to profile only MPI routines in mpitest.exe by launching two instances: ---- tau_pin -n 2 -r MPI.* — mpitest.exe ---- .Wildcards * for anything, for example *MPI means any string having MPI in between any other characters. * ? It’s a placeholder wild card ?MPI* means any character followed by MPI and followed by any string, example: ??Try could be __Try or MyTry or MeTry etc.
7.41. tau_java
Instruments java applications at runtime using JVMTI
tau_java [<options>] [<args>]
` `-help
|
Displays help information. |
` `-verbose
|
Report the arguments of the script before it runs. |
` `-tau:agentlib=<agentlib>
|
By default tau_java uses the most recently configured jdk, you can specify a different one here. |
` `-tau:java=<javapath>
|
Path to a java binary, by default uses the one corresponding to the most recently configured jdk. |
` `-tau:bootclasspath= <bootclasspath>
|
To modify the bootclasspath to point to a different jar, not usually necessary. |
` `-tau:include=<item>
|
Only instrument these methods or classes. Separate multiple classes and methods with semicolons |
-tau:exclude=<item>
|
Exclude the listed classes and methods. Separate multiple classes and methods with semicolons |
args
|
the command line arguments of the java application. |
7.42. tau_cupti_avail
Detects the available CUPTI counters on the a each GPU device.
tau_cupti_avail [<counter names>]
-c counter names
|
Checks which of a colon seperated list of CUPTI counter names can be recorded. |
7.43. tau_run
Instruments and executes binaries to generate performance data. (DyninstAPI based instrumentor)
-v ``
|
optional verbose option |
-o outfile
|
for binary rewriting |
| -T<option> |
: specify TAU option |
| -loadlib=<file.so > |
: specify additional load library |
| -XrunTAU-<options> |
specify TAU library directly |
7.44. tau_rewrite
Rewrites binaries using Maqao if TAU is configured using PDT 3.17+ at the routine level. If it doesn’t find the Maqao package from PDT 3.17, it reverts to tau_run (DyninstAPI based instrumentor).
-o outfile
|
specify instrumented output file |
-T ``
|
specify TAU option (CUPTI, DISABLE, MPI, OPENMP, PDT, PGI, PROFILE, SCOREP, SERIAL) |
-loadlib= file.so
|
specify additional load library |
-s ``
|
dryrun without executing |
-v ``
|
long verbose mode |
-v1 ``
|
short verbose mode |
-XrunTAUsh- options
|
specify TAU library directly |
Defaults if unspecified: -T MPI MPI is assumed unless SERIAL is specified
---- tau_rewrite -T papi,pdt a.out -o a.inst ---- ---- mpirun -np 4 ./a.inst ----
7.45. tau_spark-submit
Launches PySpark applications with TAU instrumentation
TAU can profile PySpark applications using Spark 2.2 or later and Python 2.7 or later with the numpy package installed. TAU must be configured with the -pythoninc and -pythonlib options specifying an appropriate Python installation. The SPARK_HOME environment variable must be set to the location of your Spark installation. Replace spark-submit in your normal Spark application invocation with tau_spark-submit. Options for tau_spark-submit can be set using the TAU_SPARK_PYTHON_ARGS environment variable. A PySpark application profiled using tau_spark-submit will generate one profile file per task executed.
---- export TAU_SPARK_PYTHON_ARGS="-T serial,python" ---- ---- tau_spark-submit --master local[4] ./als.py ----
Additional documentation and examples can be found in the pyspark subdirectory of the examples directory in your TAU installation.
7.46. tau_diff.py
Compares two TAU performance profiles or directories of profiles.
path1
|
Path to the first profile or directory. (first positional argument) |
path2
|
Path to the second profile or directory. (second positional argument) |
-h --help
|
show a help message and exit |
-o OUTPUT --output OUTPUT
|
Path for the output file or directory. Defaults to ./tau_diff_results |
-t THRESHOLD --threshold THRESHOLD
|
Report entries where any metric’s % change exceeds this value. (Default: 0.0) |
--sort-by Calls|Subrs|Excl|Incl|alpha|original
|
Sort the report by the change in a metric column, alphabetically, or by the original order in the first profile. (Default: Incl) |
--check
|
Check-only mode. Exits with 0 if no differences are greater than the threshold, 1 otherwise. Suppresses all output files. |
8. TAUdb
8.1. Introduction
TAUdb (TAU Database), formerly known as PerfDMF (Performance Data Management Framework) is a an API/Toolkit that sits atop a DBMS to manage and analyze performance data. The API is available in its native Java form as well as C.
8.1.1. Prerequisites
-
A supported Database Management System (DBMS). TAUdb currently supports PostgreSQL, MySQL, Oracle, H2, and Derby. For use with the C API, only PostgreSQL is supported (SQLite support is currently being evaluated). Because they are Java only, H2 and Derby can NO be accessed with the C API.
-
Java 1.5.
-
If the C API is desired, a working C compiler is required, along with the following libraries: libpq (PostgreSQL libraries), libxml2, libz, libuuid. These libraries are all commonly installed by default on *NIX systems.
8.1.2. Installation
The TAUdb utilities and applications are installed as part of the standard TAU release. Shell scripts are installed in the TAU bin directory to configure and run the utilities. It is assumed that the user has installed TAU and run TAU’s configure and 'make install'.
-
(Optionally) Create a database. This step will depend on the user’s chosen DBMS.
-
H2: Because it is an embedded, file-based DBMS, H2 does not require creating the database before configuring TAUdb. TAUdb takes advantage of the "auto-server" capabilities in H2, so multiple clients can connect to the same database at the same time. Users should use the H2 DBMS if they expect to maintain a small to moderate local repository of performance data, and want the convenience of connecting to the database from multiple clients.
-
Derby: Because it is an embedded, file-based DBMS, Derby does not require creating the database before configuring TAUdb. Be advised that the Derby DBMS does not allow multiple clients to connect to the same database. For that reason, we suggest users use the H2 DBMS if a file-based database is desired. Derby support is maintained for backwards compatability.
-
PostgreSQL:
-
$ createdb -O taudb taudb
	  Or, from
Or, from psql
psql=# create database taudb with owner = taudb;
-
MySQL: From the MySQL prompt
mysql> create database taudb;
-
Oracle: It is recommended that you create a tablespace for taudb:
create tablespace taudb
datafile '/path/to/somewhere' size 500m reuse;

	  Then, create a user that has this tablespace as default:
Then, create a user that has this tablespace as default:
create user amorris identified by db;
grant create session to amorris;
grant create table to amorris;
grant create sequence to amorris;
grant create trigger to amorris;
alter user amorris quota unlimited on taudb;
alter user amorris default tablespace taudb;

TAUdb is set up to use the Oracle Thin Java driver.  You will have
to obtain this jar file for your DBMS.  In our case, it was
ojdbc14.jar.
TAUdb is set up to use the Oracle Thin Java driver. You will have to obtain this jar file for your DBMS. In our case, it was ojdbc14.jar.
-
Configure a TAUdb connection. To configure TAUdb, run the
taudb_configureprogram from the TAU bin directory.The configuration program will prompt the user for several values. The default values will work for most users. When configuration is complete, it will connect to the database and test the configuration. If the configuration is valid and the schema is not already found in the database (as will be the case on initial configuration), the schema will be uploaded. Be sure to specify the correct version of the schema for your DBMS.
An example session for configuring a database is below. The user is creating an H2 database, with default settings including no username and no password (recommended for file-based databases when security is not an issue).
$ taudb_configure
Configuration file NOT found...
a new configuration file will be created.

Welcome to the configuration program for PerfDMF.
This program will prompt you for some information necessary to
ensure the desired behavior for the PerfDMF tools.


You will now be prompted for new values, if desired.  The current
or default values for each prompt are shown in parenthesis.
To accept the current/default value, just press Enter/Return.

Please enter the name of this configuration.
():documentation_example
Please enter the database vendor (oracle, postgresql, mysql, db2,
derby or h2).
(h2):
Please enter the JDBC jar file.
(/Users/khuck/src/tau2/apple/lib/h2.jar):
Please enter the JDBC Driver name.
(org.h2.Driver):
Please enter the path to the database directory.
(/Users/khuck/.ParaProf/documentation_example):
Please enter the database username.
():
Store the database password in CLEAR TEXT in your configuration
file? (y/n):y
Please enter the database password:
Please enter the PerfDMF schema file.
(/Users/khuck/src/tau2/etc/taudb.sql):

Writing configuration file:
/Users/khuck/.ParaProf/perfdmf.cfg.documentation_example

Now testing your database connection.

Database created, command:
jdbc:h2:/Users/khuck/.ParaProf/documentation_example/perfdmf;AUTO_SERVER=TRUE;create=true

Uploading Schema: /Users/khuck/src/tau2/etc/taudb.sql
Found /Users/khuck/src/tau2/etc/taudb.sql  ... Loading
Successfully uploaded schema

Database connection successful.
Configuration complete.
8.2. Using TAUdb
The easiest way to interact with TAUdb is to use ParaProf which provides a GUI interface to all of the database information. In addition, the following commandline utilities are provided.
8.2.1. perfdmf_createapp (deprecated - only supported for older PerfDMF databases)
This utility creates applications with a given name
$ perfdmf_createapp -n "New Application"
Created Application, ID: 24
8.2.2. perfdmf_createexp (deprecated - only supported for older PerfDMF databases)
This utility creates experiments with a given name, under a specified application
$ perfdmf_createexp -a 24 -n "New Experiment"
Created Experiment, ID: 38
8.2.3. taudb_loadtrial
This utility uploads a trial to the database with a given name, under a specified experiment
$ taudb_loadtrial -h
Usage: perfdmf_loadtrial -a <appName> -x <expName> -n <name>
[options] <files>

Required Arguments:

  -n, --name <text>              Specify the name of the trial
  -a, --applicationname <string> Specify associated application name
                                 for this trial
  -x, --experimentname <string>  Specify associated experiment name
                                 for this trial
               ...or...

  -n, --name <text>              Specify the name of the trial
  -e, --experimentid <number>    Specify associated experiment ID
                                 for this trial

Optional Arguments:

  -c, --config <name>       Specify the name of the configuration to use
  -g, --configFile <file>   Specify the configuration file to use
                            (overrides -c)
  -f, --filetype <filetype> Specify type of performance data, options
                            are: profiles (default), pprof, dynaprof,
                            mpip, gprof, psrun, hpm, packed, cube,
                            hpc, ompp, snap, perixml, gptl, paraver,
                            ipm, google
  -t, --trialid <number>    Specify trial ID
  -i, --fixnames            Use the fixnames option for gprof
  -z, --usenull             Include NULL values as 0 for mean
                            calculation
  -r, --reduce <percentage> Aggregate all timers less than percentage
                            as "other"
  -m, --metadata <filename> XML metadata for the trial

Notes:
  For the TAU profiles type, you can specify either a specific set
of profile files on the commandline, or you can specify a directory
(by default the current directory).  The specified directory will be
searched for profile.*.*.* files, or, in the case of multiple counters,
directories named MULTI_* containing profile data.

Examples:

  perfdmf_loadtrial -e 12 -n "Batch 001"
    This will load profile.* (or multiple counters directories
    MULTI_*) into experiment 12 and give the trial the name
    "Batch 001"

  perfdmf_loadtrial -e 12 -n "HPM data 01" -f hpm perfhpm*
    This will load perfhpm* files of type HPMToolkit into experiment
    12 and give the trial the name "HPM data 01"

  perfdmf_loadtrial -a "NPB2.3" -x "parametric" -n "64" par64.ppk
    This will load packed profile par64.ppk into the experiment named
    "parametric" under the application named "NPB2.3" and give the
    trial the name "64".  The application and experiment will be
    created if not found.
TAUdb supports a large number of parallel profile formats:
TAU Profiles (profiles) - Output from the TAU measurement library, these files generally take the form of profile.X.X.X , one for each node/context/thread combination. When multiple counters are used, each metric is located in a directory prefixed with "MULTI". To launch ParaProf with all the metrics, simply launch it from the root of the MULTI directories.
ParaProf Packed Format (ppk) - Export format supported by PerfDMF/ParaProf. Typically .ppk.
TAU Merged Profiles (snap) - Merged and snapshot profile format supported by TAU. Typically tauprofile.xml.
TAU pprof (pprof) - Dump Output from TAU’s pprof -d . Provided for backward compatibility only.
DynaProf (dynaprof) - Output From DynaProf’s wallclock and papi probes.
mpiP (mpip) - Output from mpiP.
gprof (gprof) - Output from gprof, see also the --fixnames option.
PerfSuite (psrun) - Output from PerfSuite psrun files.
HPM Toolkit (hpm) - Output from IBM’s HPM Toolkit.
Cube (cube) - Output from Kojak Expert tool for use with Cube.
Cube3 (cube3) - Output from Kojak Expert tool for use with Cube3 and Cube4.
HPCToolkit (hpc) - XML data from hpcquick. Typically, the user runs hpcrun, then hpcquick on the resulting binary file.
OpenMP Profiler (ompp) - CSV format from the ompP OpenMP Profiler (http://www.ompp-tool.com). The user must use OMPP_OUTFORMAT=CVS.
PERI XML (perixml) - Output from the PERI data exchange format.
General Purpose Timing Library (gptl) - Output from the General Purpose Timing Library.
Paraver (paraver) - 2D output from the Paraver trace analysis tool from BSC.
IPM (ipm) - Integrated Performance Monitoring format, from NERSC.
Google (google) - Google Profiles.
8.2.4. TAUdb Views
In order to provide flexible data management, the application / experiment / trial hierarchy was removed in the conversion from PerfDMF to TAUdb. In addition, trial metadata was promoted from an XML blob in PerfDMF to queryable tables. Users can now organize their data in arbitrary hierarchies using Views and SubViews. Creating and using Views is outlined in the ParaProf User Manual, in Chapter 2.
8.3. Database Schema
The database schema in TAUdb is designed to flexibly and efficiently store multidimensional parallel performance data. There are 5 dimensions to the actual timer measurements, and 4 dimensions to the counter measurements
Timer dimensions
-
Process and thread of execution
-
Timer source code location (i.e. foo())
-
Metric of interest (i.e. FP_OPS, TIME)
-
Phase of execution (i.e. iteration number, timestamp)
-
Dynamic timer context (i.e. parameter values)
Counter dimensions
-
Process and thread of execution
-
Timer source code location (i.e. foo())
-
Phase of execution (i.e. iteration number, timestamp)
-
Dynamic timer context (i.e. parameter values)
8.3.1. SQL for TAUdb
Below is the SQL schema definition for TAUdb.
/****************************/
/* CREATE THE STATIC TABLES */
/****************************/

CREATE TABLE schema_version (
 version     INT NOT NULL,
 description VARCHAR NOT NULL
);
/* IF THE SCHEMA IS MODIFIED, INCREMENT THIS VALUE */
/* 0 = PERFDMF (ORIGINAL) */
/* 1 = TAUDB (APRIL, 2012) */
/*VALUES (1, 'TAUdb redesign from Spring, 2012');*/
INSERT INTO schema_version (version, description)
  VALUES (2, 'Changes after Nov. 9, 2012 release');

/* These are our supported parsers. */
CREATE TABLE data_source (
 id          INT UNIQUE NOT NULL,
 name        VARCHAR NOT NULL,
 description VARCHAR
);

INSERT INTO data_source (name,id,description)
  VALUES ('ppk',0,'TAU Packed profiles (TAU)');
INSERT INTO data_source (name,id,description)
  VALUES ('TAU profiles',1,'TAU profiles (TAU)');
INSERT INTO data_source (name,id,description)
  VALUES ('DynaProf',2,'PAPI DynaProf profiles (UTK)');
INSERT INTO data_source (name,id,description)
  VALUES ('mpiP',3,'mpiP: Lightweight, Scalable MPI Profiling (Vetter, Chambreau)');
INSERT INTO data_source (name,id,description)
  VALUES ('HPM',4,'HPM Toolkit profiles (IBM)');
INSERT INTO data_source (name,id,description)
  VALUES ('gprof',5,'gprof profiles (GNU)');
INSERT INTO data_source (name,id,description)
  VALUES ('psrun',6,'PerfSuite psrun profiles (NCSA)');
INSERT INTO data_source (name,id,description)
  VALUES ('pprof',7,'TAU pprof.dat output (TAU)');
INSERT INTO data_source (name,id,description)
  VALUES ('Cube',8,'Cube data (FZJ)');
INSERT INTO data_source (name,id,description)
  VALUES ('HPCToolkit',9,'HPC Toolkit profiles (Rice Univ.)');
INSERT INTO data_source (name,id,description)
  VALUES ('SNAP',10,'TAU Snapshot profiles (TAU)');
INSERT INTO data_source (name,id,description)
  VALUES ('OMPP',11,'OpenMP Profiler profiles (Fuerlinger)');
INSERT INTO data_source (name,id,description)
  VALUES ('PERIXML',12,'Data Exchange Format (PERI)');
INSERT INTO data_source (name,id,description)
  VALUES ('GPTL',13,'General Purpose Timing Library (ORNL)');
INSERT INTO data_source (name,id,description)
  VALUES ('Paraver',14,'Paraver profiles (BSC)');
INSERT INTO data_source (name,id,description)
  VALUES ('IPM',15,'Integrated Performance Monitoring (NERSC)');
INSERT INTO data_source (name,id,description)
  VALUES ('Google',16,'Google profiles (Google)');
INSERT INTO data_source (name,id,description)
  VALUES ('Cube3',17,'Cube 3D profiles (FZJ)');
INSERT INTO data_source (name,id,description)
  VALUES ('Gyro',100,'Self-timing profiles from Gyro application');
INSERT INTO data_source (name,id,description)
  VALUES ('GAMESS',101,'Self-timing profiles from GAMESS application');
INSERT INTO data_source (name,id,description)
  VALUES ('Other',999,'Other profiles');

/* threads make it convenient to identify timer values.
   Special values for thread_index:
   -1 mean (nulls ignored)
   -2 total
   -3 stddev (nulls ignored)
   -4 min
   -5 max
   -6 mean (nulls are 0 value)
   -7 stddev (nulls are 0 value)
*/

CREATE TABLE derived_thread_type (
 id INT NOT NULL,
 name VARCHAR NOT NULL,
 description VARCHAR NOT NULL
);

INSERT INTO derived_thread_type (id, name, description)
  VALUES (-1, 'MEAN', 'MEAN (nulls ignored)');
INSERT INTO derived_thread_type (id, name, description)
  VALUES (-2, 'TOTAL', 'TOTAL');
INSERT INTO derived_thread_type (id, name, description)
  VALUES (-3, 'STDDEV', 'STDDEV (nulls ignored)');
INSERT INTO derived_thread_type (id, name, description)
  VALUES (-4, 'MIN', 'MIN');
INSERT INTO derived_thread_type (id, name, description)
  VALUES (-5, 'MAX', 'MAX');
INSERT INTO derived_thread_type (id, name, description)
  VALUES (-6, 'MEAN', 'MEAN (nulls are 0 value)');
INSERT INTO derived_thread_type (id, name, description)
  VALUES (-7, 'STDDEV', 'STDDEV (nulls are 0 value)');

/**************************/
/* CREATE THE TRIAL TABLE */
/**************************/

/* trials are the top level table */

CREATE TABLE trial (
 id                  SERIAL NOT NULL PRIMARY KEY,
 name                VARCHAR,
 /* where did this data come from? */
 data_source         INT,
 /* number of processes */
 node_count          INT,
 /* legacy values - these are actually "max" values - i.e. not all nodes have
  * this many threads */
 contexts_per_node   INT,
 /* how many threads per node? */
 threads_per_context INT,
 /* total number of threads */
 total_threads       INT,
 /* reference to the data source table. */
 FOREIGN KEY(data_source) REFERENCES data_source(id)
   ON DELETE NO ACTION ON UPDATE NO ACTION
);

/******************************/
/* CREATE THE DATA DIMENSIONS */
/******************************/

/* threads are the "location" dimension */

CREATE TABLE thread (
 id           SERIAL NOT NULL PRIMARY KEY,
 /* trial this thread belongs to */
 trial        INT NOT NULL,
 /* process rank, really */
 node_rank    INT NOT NULL,
 /* legacy value */
 context_rank INT NOT NULL,
 /* thread rank relative to the process */
 thread_rank  INT NOT NULL,
 /* thread index from 0 to N-1 */
 thread_index INT NOT NULL,
 FOREIGN KEY(trial) REFERENCES trial(id) ON DELETE
   NO ACTION ON UPDATE NO ACTION
);

/* metrics are things like num_calls, num_subroutines, TIME, PAPI
   counters, and derived metrics. */

CREATE TABLE metric (
 id      SERIAL NOT NULL PRIMARY KEY,
 /* trial this value belongs to */
 trial   INT NOT NULL,
 /* name of the metric */
 name    VARCHAR NOT NULL,
 /* if this metric is derived by one of the tools */
 derived BOOLEAN NOT NULL DEFAULT FALSE,
 FOREIGN KEY(trial) REFERENCES trial(id)
   ON DELETE NO ACTION ON UPDATE NO ACTION
);

/* timers are timers, capturing some interval value.  For callpath or
   phase profiles, the parent refers to the calling function or phase. */

CREATE TABLE timer (
 id                SERIAL NOT NULL PRIMARY KEY,
 /* trial this value belongs to */
 trial             INT NOT NULL,
 /* name of the timer */
 name              VARCHAR NOT NULL,
 /* short name of the timer - without source or parameter info */
 short_name        VARCHAR NOT NULL,
 /* filename */
 source_file       VARCHAR,
 /* line number of the start of the block of code */
 line_number       INT,
 /* line number of the end of the block of code */
 line_number_end   INT,
 /* column number of the start of the block of code */
 column_number     INT,
 /* column number of the end of the block of code */
 column_number_end INT,
 FOREIGN KEY(trial) REFERENCES trial(id)
   ON DELETE NO ACTION ON UPDATE NO ACTION
);

/* timer index on the trial and name columns */
CREATE INDEX timer_trial_index on timer (trial, name);

/***********************************/
/* CREATE THE TIMER RELATED TABLES */
/***********************************/

/* timer groups are the groups such as TAU_DEFAULT,
   MPI, OPENMP, TAU_PHASE, TAU_CALLPATH, TAU_PARAM, etc.
   This mapping table allows for NxN mappings between timers
   and groups */

CREATE TABLE timer_group (
 timer INT,
 group_name  VARCHAR NOT NULL,
 FOREIGN KEY(timer) REFERENCES timer(id)
   ON DELETE NO ACTION ON UPDATE NO ACTION
);

/* index for faster queries into groups */
CREATE INDEX timer_group_index on timer_group (timer, group_name);

/* timer parameters are parameter based profile values.
 * an example is foo (x,y) where x=4 and y=10. In that example,
 * timer would be the index of the timer with the
 * name 'foo (x,y) <x>=<4> <y>=<10>'. This table would have two
 * entries, one for the x value and one for the y value. */

CREATE TABLE timer_parameter (
 timer     INT,
 parameter_name  VARCHAR NOT NULL,
 parameter_value VARCHAR NOT NULL,
 FOREIGN KEY(timer) REFERENCES timer(id)
   ON DELETE NO ACTION ON UPDATE NO ACTION
);

/* timer callpath have the information about the call graph in a trial.
 * If the profile is "flat", these will all have no parents. Otherwise,
 * the parent points to a node in the callgraph, the calling timer
 * (function). */

CREATE TABLE timer_callpath (
 id        SERIAL NOT NULL PRIMARY KEY,
 /* what timer is this? */
 timer     INT NOT NULL,
 /* what is the parent timer? */
 parent    INT,
 FOREIGN KEY(timer) REFERENCES timer(id)
   ON DELETE NO ACTION ON UPDATE NO ACTION,
 FOREIGN KEY(parent) REFERENCES timer_callpath(id)
   ON DELETE NO ACTION ON UPDATE NO ACTION
);

/* By definition, profiles have no time data. However, there are a few
 * examples where time ranges make sense, such as tracking call stacks
 * or associating metadata to a particular phase. The time_range table
 * is used to give other measurements a time context. The iteration
 * start and end can be used to indicate which loop iterations or
 * calls to a function are relevant for this time range. */

CREATE TABLE time_range (
 id SERIAL NOT NULL PRIMARY KEY,
 /* starting iteration */
 iteration_start INT NOT NULL,
 /* ending iteration. */
 iteration_end INT,
 /* starting timestamp */
 time_start BIGINT NOT NULL,
 /* ending timestamp. */
 time_end BIGINT
);

/* timer_call_data records have the dynamic information for when a node
 * in the callgraph is visited by a thread. If you are tracking dynamic
 * callstacks, you would use the time_range field. If you are storing
 * snapshot data, you would use the time_range field. */

CREATE TABLE timer_call_data (
 id          SERIAL NOT NULL PRIMARY KEY,
 /* what callgraph node is this? */
 timer_callpath       INT NOT NULL,
 /* what thread is this? */
 thread      INT NOT NULL,
 /* how many times this timer was called */
 calls       INT,
 /* how many subroutines this timer called */
 subroutines INT,
 /* what is the time_range? this is for supporting snapshots */
 time_range  INT,
 FOREIGN KEY(timer_callpath) REFERENCES timer_callpath(id)
   ON DELETE NO ACTION ON UPDATE NO ACTION,
 FOREIGN KEY(thread) REFERENCES thread(id)
   ON DELETE NO ACTION ON UPDATE NO ACTION,
 FOREIGN KEY(time_range) REFERENCES time_range(id)
   ON DELETE NO ACTION ON UPDATE NO ACTION
);

/* timer values have the timer of one timer
   on one thread for one metric, at one location on the callgraph. */

CREATE TABLE timer_value (
 /* what node in the callgraph and thread is this? */
 timer_call_data       INT NOT NULL,
 /* what metric is this? */
 metric                INT NOT NULL,
 /* The inclusive value for this timer */
 inclusive_value       DOUBLE PRECISION,
 /* The exclusive value for this timer */
 exclusive_value       DOUBLE PRECISION,
 /* The inclusive percent for this timer */
 inclusive_percent     DOUBLE PRECISION,
 /* The exclusive percent for this timer */
 exclusive_percent     DOUBLE PRECISION,
 /* The variance for this timer */
 sum_exclusive_squared DOUBLE PRECISION,
 FOREIGN KEY(timer_call_data) REFERENCES timer_call_data(id)
   ON DELETE NO ACTION ON UPDATE NO ACTION,
 FOREIGN KEY(metric) REFERENCES metric(id)
   ON DELETE NO ACTION ON UPDATE NO ACTION
);

/* one metric, one thread, one timer */
CREATE INDEX timer_value_index on timer_value (timer_call_data, metric);

/*************************************/
/* CREATE THE COUNTER RELATED TABLES */
/*************************************/

/* counters measure some counted value. */

CREATE TABLE counter (
 id          SERIAL      NOT NULL PRIMARY KEY,
 trial       INT         NOT NULL,
 name        VARCHAR        NOT NULL,
 FOREIGN KEY(trial) REFERENCES trial(id)
   ON DELETE NO ACTION ON UPDATE NO ACTION
);

/* counter index on the trial and name columns */
CREATE INDEX counter_trial_index on counter (trial, name);

CREATE TABLE counter_value (
 /* what counter is this? */
 counter            INT NOT NULL,
 /* where in the callgraph? */
 timer_callpath     INT,
 /* what thread is this? */
 thread             INT NOT NULL,
 /* The total number of samples */
 sample_count       INT,
 /* The maximum value seen */
 maximum_value      DOUBLE PRECISION,
 /* The minimum value seen */
 minimum_value      DOUBLE PRECISION,
 /* The mean value seen */
 mean_value         DOUBLE PRECISION,
 /* The variance for this counter */
 standard_deviation DOUBLE PRECISION,
 FOREIGN KEY(counter) REFERENCES counter(id)
   ON DELETE NO ACTION ON UPDATE NO ACTION,
 FOREIGN KEY(timer_callpath) REFERENCES timer_callpath(id)
   ON DELETE NO ACTION ON UPDATE NO ACTION,
 FOREIGN KEY(thread) REFERENCES thread(id)
   ON DELETE NO ACTION ON UPDATE NO ACTION
);

/* one thread, one counter */
CREATE INDEX counter_value_index on counter_value (counter, thread);

/**************************************/
/* CREATE THE METADATA RELATED TABLES */
/**************************************/

/* primary metadata is metadata that is not nested, does not
   contain unique data for each thread. */

CREATE TABLE primary_metadata (
 trial    INT NOT NULL,
 name     VARCHAR NOT NULL,
 value    VARCHAR,
 FOREIGN KEY(trial) REFERENCES trial(id)
   ON DELETE NO ACTION ON UPDATE NO ACTION
);

/* create an index for faster queries against the primary_metadata table */
CREATE INDEX primary_metadata_index on primary_metadata (trial, name);

/* secondary metadata is metadata that could be nested, could
   contain unique data for each thread, and could be an array. */

CREATE TABLE secondary_metadata (
 id       VARCHAR NOT NULL PRIMARY KEY,
 /* trial this value belongs to */
 trial    INT NOT NULL,
 /* this metadata value could be associated with a thread */
 thread   INT,
 /* this metadata value could be associated with a timer that happened */
 timer_callpath    INT,
 /* which call to the context timer was this? */
 time_range    INT,
 /* this metadata value could be a nested structure */
 parent   VARCHAR,
 /* the name of the metadata field */
 name     VARCHAR NOT NULL,
 /* the value of the metadata field */
 value    VARCHAR,
 /* this metadata value could be an array - so tokenize it */
 is_array BOOLEAN DEFAULT FALSE,
 FOREIGN KEY(trial) REFERENCES trial(id)
   ON DELETE NO ACTION ON UPDATE NO ACTION,
 FOREIGN KEY(thread) REFERENCES thread(id)
   ON DELETE NO ACTION ON UPDATE NO ACTION,
 FOREIGN KEY(timer_callpath) REFERENCES timer_callpath(id)
   ON DELETE NO ACTION ON UPDATE NO ACTION,
 FOREIGN KEY(parent) REFERENCES secondary_metadata(id)
   ON DELETE NO ACTION ON UPDATE NO ACTION,
 FOREIGN KEY(time_range) REFERENCES time_range(id)
   ON DELETE NO ACTION ON UPDATE NO ACTION
);

/* create an index for faster queries against the secondary_metadata table */
CREATE INDEX secondary_metadata_index on secondary_metadata
   (trial, name, thread, parent);

/**************************************/
/* CREATE THE METADATA RELATED TABLES */
/**************************************/

/* this is the view table, which organizes and filters trials */
create table taudb_view (
    id                    SERIAL            NOT NULL    PRIMARY KEY,
    /* views can be nested */
    parent                INTEGER            NULL,
    /* name of the view */
    name                VARCHAR    NOT NULL,
    /* view conjoin type for parameters */
    conjoin                VARCHAR    NOT NULL,
    FOREIGN KEY (parent) REFERENCES taudb_view(id)
      ON DELETE CASCADE ON UPDATE CASCADE
);

create table taudb_view_parameter (
    /* the view ID */
    taudb_view            INTEGER    NOT NULL,
    /* the table name for the where clause */
    table_name            VARCHAR    NOT NULL,
    /* the column name for the where clause.
       If the table_name is one of the metadata tables, this is the
       value of the "name" column */
    column_name            VARCHAR    NOT NULL,
    /* the operator for the where clause */
    operator            VARCHAR    NOT NULL,
    /* the value for the where clause */
    value                VARCHAR    NOT NULL,
    FOREIGN KEY (taudb_view) REFERENCES taudb_view(id)
      ON DELETE CASCADE ON UPDATE CASCADE
);

/* simple view of all trials */
INSERT INTO taudb_view (parent, name, conjoin)
    VALUES (NULL, 'All Trials', 'and');
/* must have a parameter or else the sub views for this view
   do not work correctly*/
INSERT INTO taudb_view_parameter
    (taudb_view, table_name, column_name, operator, value)
	VALUES (1, 'trial', 'total_threads', '>', '-1');

/* the application and experiment columns are not used in the
   latest schema, but keeping them makes the code in
   PerfExplorer simpler. */
create table analysis_settings (
    id                  SERIAL          NOT NULL    PRIMARY KEY,
    taudb_view          INTEGER         NULL,
    application         INTEGER         NULL,
    experiment          INTEGER         NULL,
    trial               INTEGER         NULL,
    metric              INTEGER         NULL,
    method              VARCHAR(255)    NOT NULL,
    dimension_reduction VARCHAR(255)    NOT NULL,
    normalization       VARCHAR(255)    NOT NULL,
    FOREIGN KEY (taudb_view) REFERENCES taudb_view(id)
        ON DELETE CASCADE ON UPDATE CASCADE,
    FOREIGN KEY (trial) REFERENCES trial(id)
        ON DELETE CASCADE ON UPDATE CASCADE,
    FOREIGN KEY (metric) REFERENCES metric(id)
        ON DELETE CASCADE ON UPDATE CASCADE
);

create table analysis_result (
    id                  SERIAL          NOT NULL    PRIMARY KEY,
    analysis_settings   INTEGER         NOT NULL,
    description         VARCHAR(255)    NOT NULL,
    thumbnail_size      INTEGER         NULL,
    image_size          INTEGER         NULL,
    thumbnail           BYTEA           NULL,
    image               BYTEA           NULL,
    result_type         INTEGER         NOT NULL
);

 /* Performance indexes! */
create index trial_name_index on trial(name);
create index timer_name_index on timer(name);
CREATE INDEX timer_callpath_parent on timer_callpath(parent);
CREATE INDEX thread_trial on thread(trial);
CREATE INDEX timer_call_data_timer_callpath on
    timer_call_data(timer_callpath);
CREATE INDEX counter_name_index on counter(name);
CREATE INDEX timer_call_data_thread on timer_call_data(thread);

/* SHORT TERM FIX! These views make sure that charts
   (mostly) work... for now. */

DROP VIEW IF EXISTS interval_location_profile;
DROP VIEW IF EXISTS interval_mean_summary;
DROP VIEW IF EXISTS interval_total_summary;
DROP VIEW IF EXISTS interval_event_value;
DROP VIEW IF EXISTS interval_event;
DROP VIEW IF EXISTS atomic_location_profile;
DROP VIEW IF EXISTS atomic_mean_summary;
DROP VIEW IF EXISTS atomic_total_summary;
DROP VIEW IF EXISTS atomic_event_value;
DROP VIEW IF EXISTS atomic_event;

CREATE OR REPLACE VIEW interval_event
(id, trial, name, group_name, source_file, line_number, line_number_end)
AS
SELECT tcp.id, t.trial, t.name, tg.group_name,
t.source_file, t.line_number, t.line_number_end
FROM timer_callpath tcp
INNER JOIN timer t ON tcp.timer = t.id
INNER JOIN timer_group tg ON tg.timer = t.id;

CREATE OR REPLACE VIEW interval_event_value
(interval_event, node, context, thread, metric, inclusive_percentage,
inclusive, exclusive_percentage, exclusive, call, subroutines,
inclusive_per_call, sum_exclusive_squared)
AS SELECT tcd.timer_callpath, t.node_rank, t.context_rank,
t.thread_rank, tv.metric, tv.inclusive_percent,
tv.inclusive_value, tv.exclusive_percent, tv.exclusive_value, tcd.calls,
tcd.subroutines, tv.inclusive_value / tcd.calls, tv.sum_exclusive_squared
FROM timer_value tv
INNER JOIN timer_call_data tcd on tv.timer_call_data = tcd.id
INNER JOIN thread t on tcd.thread = t.id;

CREATE OR REPLACE VIEW interval_location_profile
AS SELECT * from interval_event_value WHERE thread >= 0;

CREATE OR REPLACE VIEW interval_total_summary
AS SELECT * from interval_event_value WHERE thread = -2;

CREATE OR REPLACE VIEW interval_mean_summary
AS SELECT * from interval_event_value WHERE thread = -1;


CREATE OR REPLACE VIEW atomic_event
(id, trial, name, group_name, source_file, line_number)
AS SELECT c.id, c.trial, c.name, NULL, NULL, NULL
FROM counter c;

CREATE OR REPLACE VIEW atomic_event_value
(atomic_event, node, context, thread, sample_count,
maximum_value, minimum_value, mean_value, standard_deviation)
AS SELECT cv.counter, t.node_rank, t.context_rank, t.thread_rank,
cv.sample_count, cv.maximum_value, cv.minimum_value, cv.mean_value,
cv.standard_deviation FROM counter_value cv
INNER JOIN thread t ON cv.thread = t.id;

CREATE OR REPLACE VIEW atomic_location_profile
AS SELECT * FROM atomic_event_value WHERE thread >= 0;

CREATE OR REPLACE VIEW atomic_total_summary
AS SELECT * FROM atomic_event_value WHERE thread = -2;

CREATE OR REPLACE VIEW atomic_mean_summary
AS SELECT * FROM atomic_event_value WHERE thread >= -1;
8.4. TAUdb C API
8.4.1. TAUdb C API Overview
The C API for TAUdb is currently under development, but there is a beta version of the API available. The API provides the following capabilities:
-
Loading trials from the database
-
Inserting trials into the database
-
Parsing TAU profile files
8.4.2. TAUdb C Structures
The C structures are roughly organized as a tree, with a trial object at the root.
-
taudb_trial: A top-level structure which contains the collections of all the performance data dimensions.
-
taudb_primary_metadata: Name/value pairs which describe the properties of the trial.
-
taudb_secondary_metadata: Name/value pairs which describe the properties of the trial. Unlike primary_metadata values, secondary_metadata objects can have complex value types. They are also associated with a measurement context - a thread of execution, a timer, a timestamp, an iteration, etc.
-
taudb_thread: A structure which represents a thread of execution in the parallel measurement.
-
taudb_time_range: A structure which holds a time-range value of beginning and ending iteration numbers or timestamps.
-
taudb_metric: A structure which represents a unit of measurement, such as TIME, FP_OPS, L1_DCM, etc.
-
taudb_timer: A structure which represents a region of code. For example, a phase, a function, a loop, a basic block, or even a line of code.
-
taudb_timer_parameter: A structure which represents parameter values, when parameter based profiling is used.
-
taudb_timer_group: A structure which represents a semantic grouping of timers, such as "I/O", "MPI", "OpenMP", etc.
-
taudb_timer_callpath: A structure which represents a node in the dynamic callpath tree. Timer_callpaths with a null parent are either top level timers, or a timers in a flat profile.
-
taudb_timer_call_data: A structure which represents a tuple between a thread of execution and a node on the timer callpath tree.
-
taudb_timer_value: A structure which represents a tuple between a timer_call_data object and a metric. The timer_value contains the measurement of one metric for one timer on one thread of execution.
-
taudb_counter: A structure which represents a counter in the profile. For example, the number of bytes transferred on an MPI_Send() timer.
-
taudb_counter_value: A structure which represents a counter measurement on one thread of execution.
Below are the object definitions, from the TAUdb C header file.
#ifndef TAUDB_STRUCTS_H
#define TAUDB_STRUCTS_H 1

#include "time.h"
#include "uthash.h"
#include "taudb_structs.h"

#if defined __TAUDB_POSTGRESQL__
#include "libpq-fe.h"
#elif defined __TAUDB_SQLITE__
#include "sqlite3.h"
#endif

#ifndef boolean
#define TRUE  1
#define FALSE 0
typedef int boolean;
#endif

typedef struct taudb_prepared_statement {
 char* name;
 UT_hash_handle hh; /* hash index for hashing by name */
} TAUDB_PREPARED_STATEMENT;

/* forward declarations to ease objects that need to know about
 * each other and have doubly-linked relationships */

struct taudb_timer_call_data;
struct taudb_timer_value;
struct taudb_timer_callpath;
struct taudb_timer_group;
struct taudb_timer_parameter;
struct taudb_timer;
struct taudb_counter_value;
struct taudb_counter;
struct taudb_primary_metadata;
struct taudb_secondary_metadata;
struct taudb_time_range;
struct taudb_thread;
struct taudb_metric;
struct taudb_trial;
struct perfdmf_experiment;
struct perfdmf_application;

typedef struct taudb_configuration {
  char* jdbc_db_type;    /* to identify DBMS vendor.
                          * postgresql, mysql, h2, derby, etc. */
  char* db_hostname;     /* server host name */
  char* db_portnum;      /* server port number */
  char* db_dbname;       /* the database name at the server */
  char* db_schemaprefix; /* the schema prefix. This is appended to
                          * all table names for some DBMSs */
  char* db_username;     /* the database username */
  char* db_password;     /* the database password for username */
  char* db_schemafile;   /* full or relative path to the schema file,
                          * used for configuration, not used in C API */
} TAUDB_CONFIGURATION;

typedef enum taudb_database_schema_version {
  TAUDB_2005_SCHEMA,
  TAUDB_2012_SCHEMA
} TAUDB_SCHEMA_VERSION;

typedef struct taudb_data_source {
 int id;
 char* name;
 char*description;
 UT_hash_handle hh1; /* hash index for hashing by id */
 UT_hash_handle hh2; /* hash index for hashing by name */
} TAUDB_DATA_SOURCE;

typedef struct taudb_connection {
  TAUDB_CONFIGURATION *configuration;
#if defined __TAUDB_POSTGRESQL__
  PGconn *connection;
  PGresult *res;
  TAUDB_PREPARED_STATEMENT *statements;
#elif defined __TAUDB_SQLITE__
  sqlite3 *connection;
  sqlite3_stmt *ppStmt;
  int rc;
#endif
  TAUDB_SCHEMA_VERSION schema_version;
  boolean inTransaction;
  boolean inPortal;
  TAUDB_DATA_SOURCE* data_sources_by_id;
  TAUDB_DATA_SOURCE* data_sources_by_name;
} TAUDB_CONNECTION;

/* these are the derived thread indexes. */

#define TAUDB_MEAN_WITHOUT_NULLS -1
#define TAUDB_TOTAL -2
#define TAUDB_STDDEV_WITHOUT_NULLS -3
#define TAUDB_MIN -4
#define TAUDB_MAX -5
#define TAUDB_MEAN_WITH_NULLS -6
#define TAUDB_STDDEV_WITH_NULLS -7

/* trials are the top level structure */

typedef struct taudb_trial {
 /* actual data from the database */
 int id;
 char* name;
 struct taudb_data_source* data_source;
 int node_count;             /* i.e. number of processes. */
 int contexts_per_node;      /* rarely used, usually 1. */
 int threads_per_context;    /* max number of threads per process
                              * (can be less on individual processes) */
 int total_threads;          /* total number of threads */
 /* arrays of data for this trial */
 struct taudb_metric* metrics_by_id;
 struct taudb_metric* metrics_by_name;
 struct taudb_thread* threads;
 struct taudb_time_range* time_ranges;
 struct taudb_timer* timers_by_id;
 struct taudb_timer* timers_by_name;
 struct taudb_timer_group* timer_groups;
 struct taudb_timer_callpath* timer_callpaths_by_id;
 struct taudb_timer_callpath* timer_callpaths_by_name;
 struct taudb_timer_call_data* timer_call_data_by_id;
 struct taudb_timer_call_data* timer_call_data_by_key;
 struct taudb_counter* counters_by_id;
 struct taudb_counter* counters_by_name;
 struct taudb_counter_value* counter_values;
 struct taudb_primary_metadata* primary_metadata;
 struct taudb_secondary_metadata* secondary_metadata;
 struct taudb_secondary_metadata* secondary_metadata_by_key;
} TAUDB_TRIAL;

/*********************************************/
/* data dimensions */
/*********************************************/

/* thread represents one physical & logical
 * location for a measurement. */

typedef struct taudb_thread {
 int id; /* database id, also key to hash */
 struct taudb_trial* trial;
 int node_rank;    /* which process does this thread belong to? */
 int context_rank; /* which context? USUALLY 0 */
 int thread_rank;  /* what is this thread's rank in the process */
 int index;        /* what is this threads OVERALL index?
                    * ranges from 0 to trial.thread_count-1 */
 struct taudb_secondary_metadata* secondary_metadata;
 UT_hash_handle hh;
} TAUDB_THREAD;

/* metrics are things like TIME, PAPI counters, and derived metrics. */

typedef struct taudb_metric {
 int id; /* database value, also key to hash */
 char* name; /* key to hash hh2 */
 boolean derived;  /* was this metric measured, or created by a
                    * post-processing tool? */
 UT_hash_handle hh1; /* hash index for hashing by id */
 UT_hash_handle hh2; /* hash index for hashing by name */
} TAUDB_METRIC;

/* Time ranges are ways to delimit the profile data within time ranges.
   They are also useful for secondary metadata which is associated with
   a specific call to a function. */

typedef struct taudb_time_range {
 int id; /* database value, also key to hash */
 int iteration_start;
 int iteration_end;
 uint64_t time_start;
 uint64_t time_end;  /* was this metric measured,
                      * or created by a post-processing tool? */
 UT_hash_handle hh;
} TAUDB_TIME_RANGE;

/* timers are interval timers, capturing some interval value.
 * For callpath or phase profiles, the parent refers to the calling
 * function or phase.  Timers can also be sample locations, or
 * phases (dynamic or static), or sample aggregations (intermediate) */

typedef struct taudb_timer {
 int id; /* database value, also key to hash */
 struct taudb_trial* trial;  /* pointer back to trial - NOTE: Necessary? */
 char* name;  /* the full timer name, can have file, line, etc. */
 char* short_name;  /* just the function name, for example */
 char* source_file;  /* what source file does this function live in? */
 int line_number;  /* what line does the timer start on? */
 int line_number_end;  /* what line does the timer end on? */
 int column_number;  /* what column number does the timer start on? */
 int column_number_end;  /* what column number does the timer end on? */
 struct taudb_timer_group* groups; /* hash of groups,
                                    * using group hash handle hh2 */
 struct taudb_timer_parameter* parameters; /* array of parameters */
 UT_hash_handle trial_hash_by_id;  /* hash key for id lookup */
 UT_hash_handle trial_hash_by_name;  /* hash key for name lookup
                                      * in temporary hash */
 UT_hash_handle group_hash_by_name;  /* hash key for name lookup
                                      * in timer group */
} TAUDB_TIMER;

/*********************************************/
/* timer related structures  */
/*********************************************/

/* timer groups are the groups such as tau_default,
   mpi, openmp, tau_phase, tau_callpath, tau_param, etc.
   this mapping table allows for nxn mappings between timers
   and groups */

typedef struct taudb_timer_group {
 char* name;
 struct taudb_timer* timers;   /* hash of timers,
                                * using timer hash handle hh3 */
 UT_hash_handle trial_hash_by_name;  // hash handle for trial
 UT_hash_handle timer_hash_by_name;  // hash handle for timers
} TAUDB_TIMER_GROUP;

/* timer parameters are parameter based profile values.
   an example is foo (x,y) where x=4 and y=10. in that example,
   timer would be the index of the timer with the
   name 'foo (x,y) <x>=<4> <y>=<10>'. this table would have two
   entries, one for the x value and one for the y value.
   The parameter can also be a phase / iteration index.
*/

typedef struct taudb_timer_parameter {
 char* name;
 char* value;
 UT_hash_handle hh;
} TAUDB_TIMER_PARAMETER;

/* callpath objects contain the merged dynamic callgraph tree seen
 * during execution */

typedef struct taudb_timer_callpath {
 int id; /* link back to database, and hash key */
 struct taudb_timer* timer; /* which timer is this? */
 struct taudb_timer_callpath *parent; /* callgraph parent */
 char* name; /* a string which has the aggregated callpath. */
 UT_hash_handle hh1; /* hash key for hash by id */
 UT_hash_handle hh2; /* hash key for name (a => b => c...) lookup */
} TAUDB_TIMER_CALLPATH;

/* timer_call_data objects are observations of a node of the callgraph
   for one of the threads. */

typedef struct taudb_call_data_key {
 struct taudb_timer_callpath *timer_callpath; /* link back to database */
 struct taudb_thread *thread; /* link back to database, roundabout way */
 char* timestamp; /* timestamp in case we are in a snapshot or something */
} TAUDB_TIMER_CALL_DATA_KEY;

typedef struct taudb_timer_call_data {
 int id; /* link back to database */
 TAUDB_TIMER_CALL_DATA_KEY key; /* hash table key */
 int calls;  /* number of times this timer was seen */
 int subroutines;  /* number of timers this timer calls */
 struct taudb_timer_value* timer_values;
 UT_hash_handle hh1;
 UT_hash_handle hh2;
} TAUDB_TIMER_CALL_DATA;

/* finally, timer_values are specific measurements during one of the
   observations of the node of the callgraph on a thread. */

typedef struct taudb_timer_value {
 struct taudb_metric* metric;   /* which metric is this? */
 double inclusive;              /* the inclusive value of this metric */
 double exclusive;              /* the exclusive value of this metric */
 double inclusive_percentage;   /* the inclusive percentage of
                                 * total time of the application */
 double exclusive_percentage;   /* the exclusive percentage of
                                 * total time of the application */
 double sum_exclusive_squared;  /* how much variance did we see
                                 * every time we measured this timer? */
 char *key; /* hash table key - metric name */
 UT_hash_handle hh;
} TAUDB_TIMER_VALUE;

/*********************************************/
/* counter related structures  */
/*********************************************/

/* counters measure some counted value. An example would be MPI message size
 * for an MPI_Send.  */

typedef struct taudb_counter {
 int id; /* database reference */
 struct taudb_trial* trial;
 char* name;
 UT_hash_handle hh1; /* hash key for hashing by id */
 UT_hash_handle hh2; /* hash key for hashing by name */
} TAUDB_COUNTER;

/* counters are atomic counters, not just interval timers */

typedef struct taudb_counter_value_key {
 struct taudb_counter* counter; /* the counter we are measuring */
 struct taudb_thread* thread;   /* where this measurement is */
 struct taudb_timer_callpath* context; /* the calling context (can be null) */
 char* timestamp; /* timestamp in case we are in a snapshot or something */
} TAUDB_COUNTER_VALUE_KEY;

typedef struct taudb_counter_value {
 TAUDB_COUNTER_VALUE_KEY key;
 int sample_count;          /* how many times did we see take this count? */
 double maximum_value;      /* what was the max value we saw? */
 double minimum_value;      /* what was the min value we saw? */
 double mean_value;         /* what was the average value we saw? */
 double standard_deviation; /* how much variance was there? */
 UT_hash_handle hh1; /* hash key for hashing by key */
} TAUDB_COUNTER_VALUE;

/*********************************************/
/* metadata related structures  */
/*********************************************/

/* primary metadata is metadata that is not nested, does not
   contain unique data for each thread. */

typedef struct taudb_primary_metadata {
 char* name;
 char* value;
 UT_hash_handle hh; /* uses the name as the key */
} TAUDB_PRIMARY_METADATA;

/* primary metadata is metadata that could be nested, could
   contain unique data for each thread, and could be an array. */

typedef struct taudb_secondary_metadata_key {
 struct taudb_timer_callpath *timer_callpath; /* link back to database */
 struct taudb_thread *thread; /* link back to database, roundabout way */
 struct taudb_secondary_metadata* parent; /* self-referencing */
 struct taudb_time_range* time_range;
 char* name;
} TAUDB_SECONDARY_METADATA_KEY;

typedef struct taudb_secondary_metadata {
 char* id; /* link back to database */
 TAUDB_SECONDARY_METADATA_KEY key;
 int num_values; /* can have arrays of data */
 char** value;
 int child_count;
 struct taudb_secondary_metadata* children; /* self-referencing  */
 UT_hash_handle hh; /* uses the id as a compound key */
 UT_hash_handle hh2; /* uses the key as a compound key */
} TAUDB_SECONDARY_METADATA;

/* these are for supporting the older schema */

typedef struct perfdmf_experiment {
 int id;
 char* name;
 struct taudb_primary_metadata* primary_metadata;
} PERFDMF_EXPERIMENT;

typedef struct perfdmf_application {
 int id;
 char* name;
 struct taudb_primary_metadata* primary_metadata;
} PERFDMF_APPLICATION;

#endif /* TAUDB_STRUCTS_H */
8.4.3. TAUdb C API
#ifndef TAUDB_API_H
#define TAUDB_API_H 1

#include "taudb_structs.h"

/* when a "get" function is called, this global has the number of
   top-level objects that are returned. */
extern int taudb_numItems;

/* the database version */
extern enum taudb_database_schema_version taudb_version;

/* to connect to the database */
extern TAUDB_CONNECTION* taudb_connect_config(char* config_name);
extern TAUDB_CONNECTION* taudb_connect_config_file(char* config_file_name);

/* test the connection status */
extern int taudb_check_connection(TAUDB_CONNECTION* connection);

/* disconnect from the database */
extern int taudb_disconnect(TAUDB_CONNECTION* connection);

/************************************************/
/* query functions */
/************************************************/

/* functions to support the old database schema - avoid these if you can */
extern PERFDMF_APPLICATION*
    perfdmf_query_applications(TAUDB_CONNECTION* connection);
extern PERFDMF_EXPERIMENT*
    perfdmf_query_experiments(TAUDB_CONNECTION* connection,
	PERFDMF_APPLICATION* application);
extern PERFDMF_APPLICATION*
    perfdmf_query_application(TAUDB_CONNECTION* connection, char* name);
extern PERFDMF_EXPERIMENT*
    perfdmf_query_experiment(TAUDB_CONNECTION* connection,
	PERFDMF_APPLICATION* application, char* name);
extern TAUDB_TRIAL* perfdmf_query_trials(TAUDB_CONNECTION* connection,
    PERFDMF_EXPERIMENT* experiment);

/* get the data sources */
extern TAUDB_DATA_SOURCE*
    taudb_query_data_sources(TAUDB_CONNECTION* connection);
extern TAUDB_DATA_SOURCE*
    taudb_get_data_source_by_id(TAUDB_DATA_SOURCE* data_sources,
	const int id);
extern TAUDB_DATA_SOURCE*
    taudb_get_data_source_by_name(TAUDB_DATA_SOURCE* data_sources,
	const char* name);

/* using the properties set in the filter, find a set of trials */
extern TAUDB_TRIAL*
    taudb_query_trials(TAUDB_CONNECTION* connection, boolean complete,
	TAUDB_TRIAL* filter);
extern TAUDB_PRIMARY_METADATA*
    taudb_query_primary_metadata(TAUDB_CONNECTION* connection,
	TAUDB_TRIAL* filter);
extern TAUDB_PRIMARY_METADATA*
    taudb_get_primary_metadata_by_name(TAUDB_PRIMARY_METADATA* primary_metadata,
	const char* name);
extern TAUDB_SECONDARY_METADATA*
    taudb_query_secondary_metadata(TAUDB_CONNECTION* connection,
	TAUDB_TRIAL* filter);

/* get the threads for a trial */
extern TAUDB_THREAD*
    taudb_query_threads(TAUDB_CONNECTION* connection, TAUDB_TRIAL* trial);
extern TAUDB_THREAD*
    taudb_query_derived_threads(TAUDB_CONNECTION* connection,
	TAUDB_TRIAL* trial);
extern TAUDB_THREAD*
    taudb_get_thread(TAUDB_THREAD* threads, int thread_index);
extern int taudb_get_total_threads(TAUDB_THREAD* threads);

/* get the metrics for a trial */
extern TAUDB_METRIC*
    taudb_query_metrics(TAUDB_CONNECTION* connection, TAUDB_TRIAL* trial);
extern TAUDB_METRIC*
    taudb_get_metric_by_name(TAUDB_METRIC* metrics, const char* name);
extern TAUDB_METRIC*
    taudb_get_metric_by_id(TAUDB_METRIC* metrics, const int id);

/* get the time_ranges for a trial */
extern TAUDB_TIME_RANGE*
    taudb_query_time_range(TAUDB_CONNECTION* connection,
	TAUDB_TRIAL* trial);
extern TAUDB_TIME_RANGE*
    taudb_get_time_range(TAUDB_TIME_RANGE* time_ranges, const int id);

/* get the timers for a trial */
extern TAUDB_TIMER*
    taudb_query_timers(TAUDB_CONNECTION* connection, TAUDB_TRIAL* trial);
extern TAUDB_TIMER*
    taudb_get_timer_by_id(TAUDB_TIMER* timers, int id);
extern TAUDB_TIMER*
    taudb_get_trial_timer_by_name(TAUDB_TIMER* timers, const char* id);
extern TAUDB_TIMER*
    taudb_get_trial_timer_by_name(TAUDB_TIMER* timers, const char* id);
extern TAUDB_TIMER_GROUP*
    taudb_query_timer_groups(TAUDB_CONNECTION* connection,
	TAUDB_TRIAL* trial);
extern void
    taudb_parse_timer_group_names(TAUDB_TRIAL* trial, TAUDB_TIMER* timer,
	char* group_names);
extern TAUDB_TIMER_GROUP*
    taudb_get_timer_group_from_trial_by_name(TAUDB_TIMER_GROUP* timers,
	const char* name);
extern TAUDB_TIMER_GROUP*
    taudb_get_timer_group_from_timer_by_name(TAUDB_TIMER_GROUP* timers,
	const char* name);
extern TAUDB_TIMER_CALLPATH*
    taudb_query_timer_callpaths(TAUDB_CONNECTION* connection,
	TAUDB_TRIAL* trial, TAUDB_TIMER* timer);
extern TAUDB_TIMER_CALLPATH*
    taudb_get_timer_callpath_by_id(TAUDB_TIMER_CALLPATH* timers, int id);
extern TAUDB_TIMER_CALLPATH*
    taudb_get_timer_callpath_by_name(TAUDB_TIMER_CALLPATH* timers,
	const char* id);
extern TAUDB_TIMER_CALLPATH*
    taudb_query_all_timer_callpaths(TAUDB_CONNECTION* connection,
	TAUDB_TRIAL* trial);
extern char* taudb_get_callpath_string(TAUDB_TIMER_CALLPATH* timer_callpath);

/* get the counters for a trial */
extern TAUDB_COUNTER*
    taudb_query_counters(TAUDB_CONNECTION* connection, TAUDB_TRIAL* trial);
extern TAUDB_COUNTER*
    taudb_get_counter_by_id(TAUDB_COUNTER* counters, int id);
extern TAUDB_COUNTER*
    taudb_get_counter_by_name(TAUDB_COUNTER* counters, const char* id);
extern TAUDB_COUNTER_VALUE*
    taudb_query_counter_values(TAUDB_CONNECTION* connection,
	TAUDB_TRIAL* trial);
TAUDB_COUNTER_VALUE*
    taudb_get_counter_value(TAUDB_COUNTER_VALUE* counter_values,
	TAUDB_COUNTER* counter, TAUDB_THREAD* thread,
	TAUDB_TIMER_CALLPATH* context, char* timestamp);

/* get the timer call data for a trial */
extern TAUDB_TIMER_CALL_DATA*
    taudb_query_timer_call_data(TAUDB_CONNECTION* connection,
	TAUDB_TRIAL* trial, TAUDB_TIMER_CALLPATH* timer_callpath,
	TAUDB_THREAD* thread);
extern TAUDB_TIMER_CALL_DATA*
    taudb_query_all_timer_call_data(TAUDB_CONNECTION* connection,
	TAUDB_TRIAL* trial);
extern TAUDB_TIMER_CALL_DATA*
    taudb_query_timer_call_data_stats(TAUDB_CONNECTION* connection,
	TAUDB_TRIAL* trial, TAUDB_TIMER_CALLPATH* timer_callpath,
	TAUDB_THREAD* thread);
extern TAUDB_TIMER_CALL_DATA*
    taudb_query_all_timer_call_data_stats(TAUDB_CONNECTION* connection,
	TAUDB_TRIAL* trial);
extern TAUDB_TIMER_CALL_DATA*
    taudb_get_timer_call_data_by_id(TAUDB_TIMER_CALL_DATA* timer_call_data,
	int id);
extern TAUDB_TIMER_CALL_DATA*
    taudb_get_timer_call_data_by_key(TAUDB_TIMER_CALL_DATA* timer_call_data,
	TAUDB_TIMER_CALLPATH* callpath, TAUDB_THREAD* thread, char* timestamp);

/* get the timer values for a trial */
extern TAUDB_TIMER_VALUE*
    taudb_query_timer_values(TAUDB_CONNECTION* connection,
	TAUDB_TRIAL* trial, TAUDB_TIMER_CALLPATH* timer_callpath,
	TAUDB_THREAD* thread, TAUDB_METRIC* metric);
extern TAUDB_TIMER_VALUE*
    taudb_query_timer_stats(TAUDB_CONNECTION* connection,
	TAUDB_TRIAL* trial, TAUDB_TIMER_CALLPATH* timer_callpath,
	TAUDB_THREAD* thread, TAUDB_METRIC* metric);
extern TAUDB_TIMER_VALUE*
    taudb_query_all_timer_values(TAUDB_CONNECTION* connection,
	TAUDB_TRIAL* trial);
extern TAUDB_TIMER_VALUE*
    taudb_query_all_timer_stats(TAUDB_CONNECTION* connection,
	TAUDB_TRIAL* trial);
extern TAUDB_TIMER_VALUE*
    taudb_get_timer_value(TAUDB_TIMER_CALL_DATA* timer_call_data,
	TAUDB_METRIC* metric);

/* find main */
extern TAUDB_TIMER*
    taudb_query_main_timer(TAUDB_CONNECTION* connection, TAUDB_TRIAL* trial);

/* save everything */
extern void taudb_save_trial(TAUDB_CONNECTION* connection,
    TAUDB_TRIAL* trial, boolean update, boolean cascade);
extern void taudb_save_threads(TAUDB_CONNECTION* connection,
    TAUDB_TRIAL* trial, boolean update);
extern void taudb_save_metrics(TAUDB_CONNECTION* connection,
    TAUDB_TRIAL* trial, boolean update);
extern void taudb_save_timers(TAUDB_CONNECTION* connection,
    TAUDB_TRIAL* trial, boolean update);
extern void taudb_save_time_ranges(TAUDB_CONNECTION* connection,
    TAUDB_TRIAL* trial, boolean update);
extern void taudb_save_timer_groups(TAUDB_CONNECTION* connection,
    TAUDB_TRIAL* trial, boolean update);
extern void taudb_save_timer_parameters(TAUDB_CONNECTION* connection,
    TAUDB_TRIAL* trial, boolean update);
extern void taudb_save_timer_callpaths(TAUDB_CONNECTION* connection,
    TAUDB_TRIAL* trial, boolean update);
extern void taudb_save_timer_call_data(TAUDB_CONNECTION* connection,
    TAUDB_TRIAL* trial, boolean update);
extern void taudb_save_timer_values(TAUDB_CONNECTION* connection,
    TAUDB_TRIAL* trial, boolean update);
extern void taudb_save_counters(TAUDB_CONNECTION* connection,
    TAUDB_TRIAL* trial, boolean update);
extern void taudb_save_counter_values(TAUDB_CONNECTION* connection,
    TAUDB_TRIAL* trial, boolean update);
extern void taudb_save_primary_metadata(TAUDB_CONNECTION* connection,
    TAUDB_TRIAL* trial, boolean update);
extern void taudb_save_secondary_metadata(TAUDB_CONNECTION* connection,
    TAUDB_TRIAL* trial, boolean update);

/************************************************/
/* memory functions */
/************************************************/

extern char* taudb_strdup(const char* in_string);
extern TAUDB_TRIAL* taudb_create_trials(int count);
extern TAUDB_METRIC*             taudb_create_metrics(int count);
extern TAUDB_TIME_RANGE*         taudb_create_time_ranges(int count);
extern TAUDB_THREAD*             taudb_create_threads(int count);
extern TAUDB_SECONDARY_METADATA* taudb_create_secondary_metadata(int count);
extern TAUDB_PRIMARY_METADATA*   taudb_create_primary_metadata(int count);
extern TAUDB_PRIMARY_METADATA*   taudb_resize_primary_metadata(int count,
    TAUDB_PRIMARY_METADATA* old_primary_metadata);
extern TAUDB_COUNTER*            taudb_create_counters(int count);
extern TAUDB_COUNTER_VALUE*      taudb_create_counter_values(int count);
extern TAUDB_TIMER*              taudb_create_timers(int count);
extern TAUDB_TIMER_PARAMETER*    taudb_create_timer_parameters(int count);
extern TAUDB_TIMER_GROUP*        taudb_create_timer_groups(int count);
extern TAUDB_TIMER_GROUP*        taudb_resize_timer_groups(int count,
    TAUDB_TIMER_GROUP* old_groups);
extern TAUDB_TIMER_CALLPATH*     taudb_create_timer_callpaths(int count);
extern TAUDB_TIMER_CALL_DATA*    taudb_create_timer_call_data(int count);
extern TAUDB_TIMER_VALUE*        taudb_create_timer_values(int count);

extern void taudb_delete_trials(TAUDB_TRIAL* trials, int count);

/************************************************/
/* Adding objects to the hierarchy */
/************************************************/

extern void taudb_add_metric_to_trial(TAUDB_TRIAL* trial,
    TAUDB_METRIC* metric);
extern void taudb_add_time_range_to_trial(TAUDB_TRIAL* trial,
    TAUDB_TIME_RANGE* time_range);
extern void taudb_add_thread_to_trial(TAUDB_TRIAL* trial,
    TAUDB_THREAD* thread);
extern void taudb_add_secondary_metadata_to_trial(TAUDB_TRIAL* trial,
    TAUDB_SECONDARY_METADATA* secondary_metadata);
extern void taudb_add_secondary_metadata_to_secondary_metadata
    (TAUDB_SECONDARY_METADATA* parent, TAUDB_SECONDARY_METADATA* child);
extern void taudb_add_primary_metadata_to_trial(TAUDB_TRIAL* trial,
    TAUDB_PRIMARY_METADATA* primary_metadata);
extern void taudb_add_counter_to_trial(TAUDB_TRIAL* trial,
    TAUDB_COUNTER* counter);
extern void taudb_add_counter_value_to_trial(TAUDB_TRIAL* trial,
    TAUDB_COUNTER_VALUE* counter_value);
extern void taudb_add_timer_to_trial(TAUDB_TRIAL* trial,
    TAUDB_TIMER* timer);
extern void taudb_add_timer_parameter_to_trial(TAUDB_TRIAL* trial,
    TAUDB_TIMER_PARAMETER* timer_parameter);
extern void taudb_add_timer_group_to_trial(TAUDB_TRIAL* trial,
    TAUDB_TIMER_GROUP* timer_group);
extern void taudb_add_timer_to_timer_group(TAUDB_TIMER_GROUP* timer_group,
    TAUDB_TIMER* timer);
extern void taudb_add_timer_callpath_to_trial(TAUDB_TRIAL* trial,
    TAUDB_TIMER_CALLPATH* timer_callpath);
extern void taudb_add_timer_call_data_to_trial(TAUDB_TRIAL* trial,
    TAUDB_TIMER_CALL_DATA* timer_call_data);
extern void taudb_add_timer_value_to_timer_call_data
    (TAUDB_TIMER_CALL_DATA* timer_call_data, TAUDB_TIMER_VALUE* timer_value);

/* Profile parsers */
extern TAUDB_TRIAL* taudb_parse_tau_profiles(const char* directory_name);

/* Analysis routines */
extern void taudb_compute_statistics(TAUDB_TRIAL* trial);

/* iterators */
extern TAUDB_DATA_SOURCE*
    taudb_next_data_source_by_name_from_connection
	(TAUDB_DATA_SOURCE* current);
extern TAUDB_DATA_SOURCE*
    taudb_next_data_source_by_id_from_connection
	(TAUDB_DATA_SOURCE* current);
extern TAUDB_THREAD*
    taudb_next_thread_by_index_from_trial(TAUDB_THREAD* current);
extern TAUDB_METRIC*
    taudb_next_metric_by_name_from_trial(TAUDB_METRIC* current);
extern TAUDB_METRIC*
    taudb_next_metric_by_id_from_trial(TAUDB_METRIC* current);
extern TAUDB_TIME_RANGE*
    taudb_next_time_range_by_id_from_trial(TAUDB_TIME_RANGE* current);
extern TAUDB_TIMER*
    taudb_next_timer_by_name_from_trial(TAUDB_TIMER* current);
extern TAUDB_TIMER*
    taudb_next_timer_by_id_from_trial(TAUDB_TIMER* current);
extern TAUDB_TIMER*
    taudb_next_timer_by_name_from_group(TAUDB_TIMER* current);
extern TAUDB_TIMER_GROUP*
    taudb_next_timer_group_by_name_from_trial
	(TAUDB_TIMER_GROUP* current);
extern TAUDB_TIMER_GROUP*
    taudb_next_timer_group_by_name_from_timer
	(TAUDB_TIMER_GROUP* current);
extern TAUDB_TIMER_PARAMETER*
    taudb_next_timer_parameter_by_name_from_timer
	(TAUDB_TIMER_PARAMETER* current);
extern TAUDB_TIMER_CALLPATH*
    taudb_next_timer_callpath_by_name_from_trial
	(TAUDB_TIMER_CALLPATH* current);
extern TAUDB_TIMER_CALLPATH*
    taudb_next_timer_callpath_by_id_from_trial
	(TAUDB_TIMER_CALLPATH* current);
extern TAUDB_TIMER_CALL_DATA*
    taudb_next_timer_call_data_by_key_from_trial
	(TAUDB_TIMER_CALL_DATA* current);
extern TAUDB_TIMER_CALL_DATA*
    taudb_next_timer_call_data_by_id_from_trial
	(TAUDB_TIMER_CALL_DATA* current);
extern TAUDB_TIMER_VALUE*
    taudb_next_timer_value_by_metric_from_timer_call_data
	(TAUDB_TIMER_VALUE* current);
extern TAUDB_COUNTER*
    taudb_next_counter_by_name_from_trial(TAUDB_COUNTER* current);
extern TAUDB_COUNTER*
    taudb_next_counter_by_id_from_trial(TAUDB_COUNTER* current);
extern TAUDB_COUNTER_VALUE*
    taudb_next_counter_value_by_key_from_trial(TAUDB_COUNTER_VALUE* current);
extern TAUDB_PRIMARY_METADATA*
    taudb_next_primary_metadata_by_name_from_trial
	(TAUDB_PRIMARY_METADATA* current);
extern TAUDB_SECONDARY_METADATA*
    taudb_next_secondary_metadata_by_key_from_trial
	(TAUDB_SECONDARY_METADATA* current);
extern TAUDB_SECONDARY_METADATA*
    taudb_next_secondary_metadata_by_id_from_trial
	(TAUDB_SECONDARY_METADATA* current);

#endif /* TAUDB_API_H */
8.4.4. TAUdb C API Examples
Creating a trial and inserting into the database
#include "taudb_api.h"
#include <stdio.h>
#include <string.h>
#include <sys/types.h>
#include <dirent.h>
#include "dump_functions.h"

int main (int argc, char** argv) {
  TAUDB_CONNECTION* connection = NULL;
  if (argc >= 2) {
    connection = taudb_connect_config(argv[1]);
  } else {
    fprintf(stderr, "Please specify a TAUdb config file.\n");
    exit(1);
  }
  printf("Checking connection...\n");
  taudb_check_connection(connection);

  // create a trial
  TAUDB_TRIAL* trial = taudb_create_trials(1);
  trial->name = taudb_strdup("TEST TRIAL");
  // set the data source to "other"
  trial->data_source = taudb_get_data_source_by_id(
      taudb_query_data_sources(connection), 999);

  // create some metadata
  TAUDB_PRIMARY_METADATA* pm = taudb_create_primary_metadata(1);
  pm->name = taudb_strdup("Application");
  pm->value = taudb_strdup("Test Application");
  taudb_add_primary_metadata_to_trial(trial, pm);

  pm = taudb_create_primary_metadata(1);
  pm->name = taudb_strdup("Start Time");
  pm->value = taudb_strdup("2012-11-07 12:30:00");
  taudb_add_primary_metadata_to_trial(trial, pm);

  // alternatively, you can allocate the primary metadata in blocks
  pm = taudb_create_primary_metadata(10);
  pm[0].name = taudb_strdup("ClientID");
  pm[0].value = taudb_strdup("joe_user");
  taudb_add_primary_metadata_to_trial(trial, &(pm[0]));
  pm[1].name = taudb_strdup("hostname");
  pm[1].value = taudb_strdup("hopper04");
  taudb_add_primary_metadata_to_trial(trial, &(pm[1]));
  pm[2].name = taudb_strdup("Operating System");
  pm[2].value = taudb_strdup("Linux");
  taudb_add_primary_metadata_to_trial(trial, &(pm[2]));
  pm[3].name = taudb_strdup("Release");
  pm[3].value = taudb_strdup("2.6.32.36-0.5-default");
  taudb_add_primary_metadata_to_trial(trial, &(pm[3]));
  pm[4].name = taudb_strdup("Machine");
  pm[4].value = taudb_strdup("Hopper.nersc.gov");
  taudb_add_primary_metadata_to_trial(trial, &(pm[4]));
  pm[5].name = taudb_strdup("CPU Cache Size");
  pm[5].value = taudb_strdup("512 KB");
  taudb_add_primary_metadata_to_trial(trial, &(pm[5]));
  pm[6].name = taudb_strdup("CPU Clock Frequency");
  pm[6].value = taudb_strdup("800.000 MHz");
  taudb_add_primary_metadata_to_trial(trial, &(pm[6]));
  pm[7].name = taudb_strdup("CPU Model");
  pm[7].value = taudb_strdup("Quad-Core AMD Opteron(tm) Processor 8378");
  taudb_add_primary_metadata_to_trial(trial, &(pm[7]));

  // create a metric
  TAUDB_METRIC* metric = taudb_create_metrics(1);
  metric->name = taudb_strdup("TIME");
  taudb_add_metric_to_trial(trial, metric);

  // create a thread
  TAUDB_THREAD* thread = taudb_create_threads(1);
  thread->node_rank = 1;
  thread->context_rank = 1;
  thread->thread_rank = 1;
  thread->index = 1;
  taudb_add_thread_to_trial(trial, thread);

  // create a timer, timer_callpath, timer_call_data, timer_value
  TAUDB_TIMER_GROUP* timer_group = taudb_create_timer_groups(1);
  TAUDB_TIMER* timer = taudb_create_timers(1);
  TAUDB_TIMER_CALLPATH* timer_callpath = taudb_create_timer_callpaths(1);
  TAUDB_TIMER_CALL_DATA* timer_call_data = taudb_create_timer_call_data(1);
  TAUDB_TIMER_VALUE* timer_value = taudb_create_timer_values(1);

  timer->name = taudb_strdup(
      "int main(int, char **) [{kernel.c} {134,1}-{207,1}]");
  timer->short_name = taudb_strdup("main");
  timer->source_file = taudb_strdup("kernel.c");
  timer->line_number = 134;
  timer->column_number = 1;
  timer->line_number_end = 207;
  timer->column_number_end = 1;
  taudb_add_timer_to_trial(trial, timer);

  timer_group->name = taudb_strdup("TAU_DEFAULT");
  taudb_add_timer_group_to_trial(trial, timer_group);
  taudb_add_timer_to_timer_group(timer_group, timer);

  timer_callpath->timer = timer;
  timer_callpath->parent = NULL;
  taudb_add_timer_callpath_to_trial(trial, timer_callpath);

  timer_call_data->key.timer_callpath = timer_callpath;
  timer_call_data->key.thread = thread;
  timer_call_data->calls = 1;
  timer_call_data->subroutines = 0;
  taudb_add_timer_call_data_to_trial(trial, timer_call_data);

  timer_value->metric = metric;
  // 5 seconds, or 5 million microseconds
  timer_value->inclusive = 5000000;
  timer_value->exclusive = 5000000;
  timer_value->inclusive_percentage = 100.0;
  timer_value->exclusive_percentage = 100.0;
  timer_value->sum_exclusive_squared = 0.0;
  taudb_add_timer_value_to_timer_call_data(timer_call_data, timer_value);

  // compute stats
  printf("Computing Stats...\n");
  taudb_compute_statistics(trial);

  // save the trial!
  printf("Testing inserts...\n");
  boolean update = FALSE;
  boolean cascade = TRUE;
  taudb_save_trial(connection, trial, update, cascade);

  printf("Disconnecting...\n");
  taudb_disconnect(connection);
  printf("Done.\n");
  return 0;
}
Querying a trial from the database
#include "taudb_api.h"
#include <stdio.h>
#include <string.h>

void dump_metadata(TAUDB_PRIMARY_METADATA *metadata) {
   printf("%d metadata fields:\n", HASH_COUNT(metadata));
   TAUDB_PRIMARY_METADATA * current;
   for(current = metadata; current != NULL;
       current = taudb_next_primary_metadata_by_name_from_trial(current)) {
     printf("  %s = %s\n", current->name, current->value);
   }
}

void dump_secondary_metadata(TAUDB_SECONDARY_METADATA *metadata) {
   printf("%d secondary metadata fields:\n", HASH_COUNT(metadata));
   TAUDB_SECONDARY_METADATA * current;
   for(current = metadata; current != NULL;
       current = taudb_next_secondary_metadata_by_key_from_trial(current)) {
     printf("  %s = %s\n", current->key.name, current->value[0]);
   }
}

void dump_trial(TAUDB_CONNECTION* connection, TAUDB_TRIAL* filter,
                boolean haveTrial) {
   TAUDB_TRIAL* trial;
   if (haveTrial) {
     trial = filter;
   } else {
     trial = taudb_query_trials(connection, FALSE, filter);
   }
   TAUDB_TIMER* timer = taudb_query_main_timer(connection, trial);
   printf("Trial name: '%s', id: %d, main: '%s'\n\n",
          trial->name, trial->id, timer->name);
}

int main (int argc, char** argv) {
   printf("Connecting...\n");
   TAUDB_CONNECTION* connection = NULL;
   if (argc >= 2) {
     connection = taudb_connect_config(argv[1]);
   } else {
     fprintf(stderr, "Please specify a TAUdb config file.\n");
     exit(1);
   }
   printf("Checking connection...\n");
   taudb_check_connection(connection);
   printf("Testing queries...\n");

   int t;

   // test the "find trials" method to populate the trial
   TAUDB_TRIAL* filter = taudb_create_trials(1);
   filter->id = atoi(argv[2]);
   TAUDB_TRIAL* trials = taudb_query_trials(connection, TRUE, filter);
   int numTrials = taudb_numItems;
   for (t = 0 ; t < numTrials ; t = t+1) {
      printf("  Trial name: '%s', id: %d\n",
	         trials[t].name, trials[t].id);
      dump_metadata(trials[t].primary_metadata);
      dump_secondary_metadata(trials[t].secondary_metadata);
      dump_trial(connection, &(trials[t]), TRUE);
   }

   printf("Disconnecting...\n");
   taudb_disconnect(connection);
   printf("Done.\n");
   return 0;
}
9. Windows
9.1. TAU on Windows
9.1.1. Installation
We provide a binary release build for Windows on the download page . TAU can also be built form source using Makefile.win32 .
9.1.2. Instrumenting an application with Visual Studio C/C++
Here is a step by step guide for retrieving a standard profile from a threaded program.
-
Download TAU (see previous section)
-
Open
[TAU-HOME]/examples/threads/threads.slnin VC 7 or greater. -
Open
testTau.cppsource file. -
Uncomment the pragma element at the top of the file so that it reads:
#define PROFILING_ON 1
#pragma comment(lib, "tau-profile-static-mt.lib")
-
Edit these properties of this project:
-
Add the
..\..\lib\vc7\directory to the Linker’s Additional Library Directories. -
Set the Runtime Library to
Multi-threaded DLL (MD)in the C/C++ Code Generation section. -
Build and run the application.
-
Launch Visual Studio’s command line prompt Move to the
[TAU-HOME]/examples/threads/directory/this is where the profile files where written. Type:
%> [TAU-HOME]/bin/paraprof
 To view these profiles in pararprof
To view these profiles in pararprof
9.1.3. Using MINGW with TAU
Building TAU with the MinGW cross-compilers for 32- or 64-bit Windows

Requirements:

MinGW compilers must be in your path.  For example (64-bit):
* x86_64-w64-mingw32-gcc
* x86_64-w64-mingw32-g++
* x86_64-w64-mingw32-ar
* x86_64-w64-mingw32-ld
* x86_64-w64-mingw32-ranlib

Limitations:

* No signal processing
* No event-based sampling (EBS)

Instructions:

See ./configure -help.
10. TAU Instrumentation API
Introduction
-
C++
The C API is a set of macros that can be inserted in the C source code. An extension of the same API is available to instrument C and Fortran sources.
At the beginning of each instrumented source file, include the following header
#include <TAU.h>
-
C
The API for instrumenting C source code is similar to the C++ API. The primary difference is that the
TAU_PROFILE()macro is not available for identifying an entire block of code or function. Instead, routine transitions are explicitly specified usingTAU_PROFILE_TIMER()macro withTAU_PROFILE_START()andTAU_PROFILE_STOP()macros to indicate the entry and exit from a routine. Note that,TAU_TYPE_STRING()and CT() macros are not applicable for C. It is important to declare theTAU_PROFILE_TIMER()macro after all the variables have been declared in the function and before the execution of the first C statement.Example:
#include <TAU.h> int main (int argc, char **argv) { int ret; pthread_attr_t attr; pthread_t tid; TAU_PROFILE_TIMER(tautimer,"main()", "int (int, char **)", TAU_DEFAULT); TAU_PROFILE_START(tautimer); TAU_PROFILE_INIT(argc, argv); TAU_PROFILE_SET_NODE(0); pthread_attr_init(&attr); printf("Started Main...\n"); // other statements TAU_PROFILE_STOP(tautimer); return 0; } -
Fortran 77/90/95
The Fortran90 TAU API allows source code written in Fortran to be instrumented for TAU. This API is comprised of Fortran routines. As explained in Chapter 2, the instrumentation can be disabled in the program by using the TAU stub makefile variable
TAU_DISABLEon the link command line. This points to a library that contains empty TAU instrumentation routines.
Timers
-
Static timers
These are commonly used in most profilers where all invocations of a routine are recorded. The name and group registration takes place when the timer is created (typically the first time a routine is entered). A given timer is started and stopped at routine entry and exit points. A user defined timer can also measure the time spent in a group of statements. Timers may be nested but they may not overlap. The performance data generated can typically answer questions such as: what is the total time spent in MPI_Send() across all invocations?
-
Dynamic timers
To record the execution of each invocation of a routine, TAU provides dynamic timers where a unique name may be constructed for a dynamic timer for each iteration by embedding the iteration count in it. It uses the start/stop calls around the code to be examined, similar to static timers. The performance data generated can typically answer questions such as: what is the time spent in the routine foo() in iterations 24, 25, and 40?
-
Static phases
An application typically goes through several phases in its execution. To track the performance of the application based on phases, TAU provides static and dynamic phase profiling. A profile based on phases highlights the context in which a routine is called. An application has a default phase within which other routines and phases are invoked. A phase based profile shows the time spent in a routine when it was in a given phase. So, if a set of instrumented routines are called directly or indirectly by a phase, we’d see the time spent in each of those routines under the given phase. Since phases may be nested, a routine may belong to only one phase. When more than one phase is active for a given routine, the closest ancestor phase of a routine along its callstack is its phase for that invocation. The performance data generated can answer questions such as: what is the total time spent in MPI_Send() when it was invoked in all invocations of the IO (IO ⇒ MPI_Send()) phase?
-
Dynamic phases
Dynamic phases borrow from dynamic timers and static phases to create performance data for all routines that are invoked in a given invocation of a phase. If we instrument a routine as a dynamic phase, creating a unique name for each of its invocations (by embedding the invocation count in the name), we can examine the time spent in all routines and child phases invoked directly or indirectly from the given phase. The performance data generated can typically answer questions such as: what is the total time spent in MPI_Send() when it was invoked directly or indirectly in iteration 24? Dynamic phases are useful for tracking per-iteration profiles for an adaptive computation where iterations may differ in their execution times.
-
Callpaths
In phase-based profiles, we see the relationship between routines and parent phases. Phase profiles do not show the calling structure between different routines as is represented in a callgraph. To do so, TAU provides callpath profiling capabilities where the time spent in a routine along an edge of a callgraph is captured. Callpath profiles present the full flat profiles of routines (or nodes in the callgraph), as well as routines along a callpath. A callpath is represented syntactically as a list of routines separated by a delimiter. The maximum depth of a callpath is controlled by an environment variable.
-
User-defined Events
Besides timers and phases that measure the time spent between a pair of start and stop calls in the code, TAU also provides support for user-defined atomic events. After an event is registered with a name, it may be triggered with a value at a given point in the source code. At the application level, we can use user-defined events to track the progress of the simulation by keeping track of application specific parameters that explain program dynamics, for example, the number of iterations required for convergence of a solver at each time step, or the number of cells in each iteration of an adaptive mesh refinement application.
10.1. TAU_START
Starts a timer.
C/C++:
      TAU_START
      char* name
Fortran:
TAU_START
character name(2)Starts the timer given by name
C/C++ :
int foo(int a) {
  TAU_START("t1");
  ...
  TAU_STOP("t2");
  return a;
}
Fortran :
subroutine F1()
  character(13) cvar

  write (cvar,'(a9,i2)') 'Iteration', val

	call TAU_START(cvar)
  ...
  call TAU_STOP(cvar)
end
10.2. TAU_STOP
Stops a timer.
C/C++:
      TAU_STOP
      char* name
Fortran:
TAU_STOP
character name(2)Stops the timer given by timer . It is important to note that timers can be nested, but not overlapping. TAU detects programming errors that lead to such overlaps at runtime, and prints a warning message.
C/C++ :
int foo(int a) {
  TAU_START("t1");
  ...
  TAU_STOP("t2");
  return a;
}
Fortran :
subroutine F1()
  character(13) cvar

  write (cvar,'(a9,i2)') 'Iteration', val
  call TAU_START(cvar)
  ...
  call TAU_STOP(cvar)
end
10.3. TAU_PROFILE
Profile a C++ function
TAU_PROFILE
      char* or string& function_name
      char* or string& type
TauGroup_t groupTAU_PROFILE profiles a function. This macro defines the function and takes care of the timer start and stop as well. The timer will stop when the macro goes out of scope (as in C++ destruction).
int foo(char *str) {
  TAU_PROFILE(foo","int (char *)",TAU_DEFAULT);
  ...
}
10.4. TAU_DYNAMIC_PROFILE
dynamic_profile a c++ function
TAU_DYNAMIC_PROFILE
      char* or string& function_name
      char* or string& type
taugroup_t groupTAU_DYNAMIC_PROFILE profiles a function dynamically creating a separate profile for each time the function is called. this macro defines the function and takes care of the timer start and stop as well. the timer will stop when the macro goes out of scope (as in c++ destruction).
int foo(char *str) {
  tau_dynamic_profile("foo","int (char *)",tau_default);
  ...
}
10.5. TAU_PROFILE_CREATE_DYNAMIC
Creates a dynamic timer
C/C++:
        TAU_PROFILE_CREATE_DYNAMIC
        Timer timer
        char* or string& function_name
        char* or string& type
        taugroup_t group
Fortran:
TAU_PROFILE_CREATE_DYNAMIC
integer timer(2)
character name(size)TAU_PROFILE_CREATE_DYNAMIC creates a dynamic timer the name of the timer should be different for each execution.
C/C++:
int main(int argc, char **argv) {
  int i;
  TAU_PROFILE_TIMER(t,"main()", "", TAU_DEFAULT);
  TAU_PROFILE_SET_NODE(0);
  TAU_PROFILE_START(t);

  for (i=0; i&5; i++) {
    char buf[32];
    sprintf(buf, "Iteration %d", i);

    TAU_PROFILE_CREATE_DYNAMIC(timer, buf, "", TAU_USER);
    TAU_PROFILE_START(timer);
    printf("Iteration %d\n", i);
    f1();

    TAU_PROFILE_STOP(timer);
  }
  return 0;
}
Fortran:
subroutine ITERATION(val)
  integer val
  character(13) cvar
  integer profiler(2) / 0, 0 /
  save profiler

  print *, "Iteration ", val

  write (cvar,'(a9,i2)') 'Iteration', val
  call TAU_PROFILE_CREATE_DYNAMIC(profiler, cvar)
  call TAU_PROFILE_START(profiler)

  call F1()
  call TAU_PROFILE_STOP(profiler)
  return
end
10.6. TAU_CREATE_DYNAMIC_AUTO
Creates a dynamic timer for C/C++
TAU_CREATE_DYNAMIC_AUTO
        Timer timer
        char* or string& function_name
        char* or string& type
taugroup_t groupTAU_CREATE_DYNAMIC_AUTO creates a dynamic timer automatically incrementing the name each time the timer is executed.
int tau_ret_val;
TAU_PROFILE_CREATE_DYNAMIC_AUTO(tautimer, "int foo1(int) C [{foo.c} {22,1}-{29,1}]", " ",TAU_USER);
TAU_PROFILE_START(tautimer);
{
printf("inside foo1: calling bar: x = %d\n", x);
printf("before calling bar in foo1\n");
bar(x-1); /* 26 */
printf("after calling bar in foo1\n");
{ tau_ret_val =  x; TAU_PROFILE_STOP(tautimer); return (tau_ret_val); }
10.7. TAU_PROFILE_DYNAMIC_ITER
Creates a dynamic timer in Fortran.
TAU_PROFILE_DYNAMIC_ITER
      integer iterator
      integer timer(2)
character name(size)TAU_PROFILE_DYNAMIC_ITER creates a dynamic timer the name of the timer is appended by the iterator.
integer tau_iter / 0 /
  save tau_iter
  tau_iter = tau_iter + 1
  call TAU_PROFILE_DYNAMIC_ITER(tau_iter, profiler, '               &
 &FOO1 [{foo.f90} {16,18}]')
  call TAU_PROFILE_START(profiler)
  print *, "inside foo1: calling bar, x = ", x
  call bar(x-1)
  print *, "after calling bar"
  call TAU_PROFILE_STOP(profiler)
10.8. TAU_PHASE_DYNAMIC_ITER
Creates a dynamic phase in Fortran.
TAU_PHASE_DYNAMIC_ITER
      integer iterator
      integer timer(2)
character name(size)TAU_PHASE_DYNAMIC_ITER creates a dynamic phase the name of which is appended by the iterator.
integer tau_iter / 0 /
  save tau_iter
  tau_iter = tau_iter + 1
  call TAU_PHASE_DYNAMIC_ITER(tau_iter, profiler, '                 &
 &FOO1 [{foo.f90} {16,18}]')
  call TAU_PHASE_START(profiler)
  print *, "inside foo1: calling bar, x = ", x
  call bar(x-1)
  print *, "after calling bar"
  call TAU_PROFILE_STOP(profiler)
10.9. TAU_PROFILE_TIMER
Defines a static timer.
C/C++:
      TAU_PROFILE_TIMER
      Profiler timer
      char* or string& function_name
      char* or string& type
      TauGroup_t group
Fortran:
TAU_PROFILE_TIMER
integer profiler(2)
character name(size)C/C++ : With TAU_PROFILE_TIMER , a group of one or more statements is profiled. This macro has a timer variable as its first argument, and then strings for name and type, as described earlier. It associates the timer to the profile group specified in the last parameter. Fortran : To profile a block of Fortran code, such as a function, subroutine, loop etc., the user must first declare a profiler, which is an integer array of two elements (pointer) with the save attribute, and pass it as the first parameter to the TAU_PROFILE_TIMER subroutine. The second parameter must contain the name of the routine, which is enclosed in a single quote. TAU_PROFILE_TIMER declares the profiler that must be used to profile a block of code. The profiler is used to profile the statements using TAU_PROFILE_START and TAU_PROFILE_STOP as explained later.
C/C++ :
template< class T, unsigned Dim >
void BareField<T,Dim>::fillGuardCells(bool reallyFill)
{y
 // profiling macros
 TAU_TYPE_STRING(taustr, CT(*this) + " void (bool)" );
 TAU_PROFILE("BareField::fillGuardCells()", taustr, TAU_FIELD);
 TAU_PROFILE_TIMER(sendtimer, "fillGuardCells-send",
                   taustr, TAU_FIELD);
 TAU_PROFILE_TIMER(localstimer, "fillGuardCells-locals",
                   taustr, TAU_FIELD);
 ...
}
Fortran :
subroutine bcast_inputs
implicit none
integer profiler(2)
save profiler

include 'mpinpb.h'
include 'applu.incl'

interger IERR

call TAU_PROFILE_TIMER(profiler, 'bcast_inputs')
TAU_PROFILE_TIMER_DYNAMIC , TAU_PROFILE_START , TAU_PROFILE_STOP
10.10. TAU_PROFILE_START
Starts a timer.
C/C++:
      TAU_PROFILE_START
      Profiler timer
Fortran:
TAU_PROFILE_START
integer profiler(2)Starts the timer given by timer
C/C++ :
int foo(int a) {
  TAU_PROFILE_TIMER(timer, "foo", "int (int)", TAU_USER);
  TAU_PROFILE_START(timer);
  ...
  TAU_PROFILE_STOP(timer);
  return a;
}
Fortran :
subroutine F1()
  integer profiler(2) / 0, 0 /
  save    profiler

  call TAU_PROFILE_TIMER(profiler,'f1()')
  call TAU_PROFILE_START(profiler)
  ...
  call TAU_PROFILE_STOP(profiler)
end
10.11. TAU_PROFILE_STOP
Stops a timer.
C/C++:
      TAU_PROFILE_STOP
      Profiler timer
Fortran:
TAU_PROFILE_STOP
integer profiler(2)Stops the timer given by timer . It is important to note that timers can be nested, but not overlapping. TAU detects programming errors that lead to such overlaps at runtime, and prints a warning message.
C/C++ :
int foo(int a) {
  TAU_PROFILE_TIMER(timer, "foo", "int (int)", TAU_USER);
  TAU_PROFILE_START(timer);
  ...
  TAU_PROFILE_STOP(timer);
  return a;
}
Fortran :
subroutine F1()
  integer profiler(2) / 0, 0 /
  save    profiler

  call TAU_PROFILE_TIMER(profiler,'f1()')
  call TAU_PROFILE_START(profiler)
  ...
  call TAU_PROFILE_STOP(profiler)
end
10.12. TAU_STATIC_TIMER_START
Starts a timer.
C/C++:
      TAU_STATIC_TIMER_START
      Profiler timer
Fortran:
TAU_STATIC_TIMER_START
integer profiler(2)Starts a static timer defined by TAU_PROFILE .
C/C++ :
TAU_PROFILE("int foo(int) [{foo.cpp} {13,1}-{20,1}]", " ", TAU_USER);

printf("inside foo: calling bar: x = %d\n", x);
printf("before calling bar in foo\n");
TAU_STATIC_TIMER_START("foo_bar");
bar(x-1); /* 17 */
printf("after calling bar in foo\n");
TAU_STATIC_TIMER_STOP("foo_bar");
Fortran :
call TAU_PROFILE_TIMER(profiler, 'FOO [{foo.f90} {8,18}]')
call TAU_PROFILE_START(profiler)
print *, "inside foo: calling bar, x = ", x
  call TAU_STATIC_TIMER_START("foo_bar");
    call bar(x-1)
  print *, "after calling bar"
    call TAU_STATIC_TIMER_STOP("foo_bar");
call TAU_PROFILE_STOP(profiler)
TAU_PROFILE , TAU_STATIC_PHASE_START , TAU_STATIC_PHASE_STOP
10.13. TAU_STATIC_TIMER_STOP
Starts a timer.
C/C++:
      TAU_STATIC_TIMER_STOP
      Profiler timer
Fortran:
TAU_STATIC_TIMER_STOP
integer profiler(2)Starts a static timer defined by TAU_PROFILE .
C/C++ :
TAU_PROFILE("int foo(int) [{foo.cpp} {13,1}-{20,1}]", " ", TAU_USER);

printf("inside foo: calling bar: x = %d\n", x);
printf("before calling bar in foo\n");
TAU_STATIC_TIMER_START("foo_bar");
bar(x-1); /* 17 */
printf("after calling bar in foo\n");
TAU_STATIC_TIMER_STOP("foo_bar");
Fortran :
call TAU_PROFILE_TIMER(profiler, 'FOO [{foo.f90} {8,18}]')
call TAU_PROFILE_START(profiler)
print *, "inside foo: calling bar, x = ", x
  call TAU_STATIC_TIMER_START("foo_bar");
    call bar(x-1)
  print *, "after calling bar"
    call TAU_STATIC_TIMER_STOP("foo_bar");
call TAU_PROFILE_STOP(profiler)
TAU_PROFILE , TAU_STATIC_PHASE_START , TAU_STATIC_PHASE_STOP
10.14. TAU_DYNAMIC_TIMER_START
Starts a dynamic timer.
C/C++:
      TAU_DYNAMIC_TIMER_START
      String name
Fortran:
TAU_DYNAMIC_TIMER_START
integer iteration
char name(size)Starts a new dynamic timer concating the iterator to the end of the name.
C/C++ :
int foo(int a) {
  TAU_PROFILE_TIMER(timer, "foo", "int (int)", TAU_USER);
  TAU_DYNAMIC_TIMER_START(timer);
  ...
  TAU_PROFILE_STOP(timer);
  return a;
}
Fortran :
integer tau_iteration / 0 /
      save tau_iteration
      call TAU_PROFILE_TIMER(profiler, 'FOO1 [{foo.f90} {16,18}]')
      call TAU_PROFILE_START(profiler)
      print *, "inside foo1: calling bar, x = ", x
      tau_iteration = tau_iteration + 1
  call TAU_DYNAMIC_TIMER_START(tau_iteration,"foo1_bar");
        call bar(x-1)
      print *, "after calling bar"
       call TAU_DYNAMIC_TIMER_STOP(tau_iteration,"foo1_bar");
  call TAU_PROFILE_STOP(profiler)
10.15. TAU_DYNAMIC_TIMER_STOP
Starts a dynamic timer.
C/C++:
      TAU_DYNAMIC_TIMER_STOP
      String name
Fortran:
TAU_DYNAMIC_TIMER_STOP
integer iteration
char name(size)Stops a new dynamic timer concating the iterator to the end of the name. timer
C/C++ :
int foo(int a) {
  TAU_PROFILE_TIMER(timer, "foo", "int (int)", TAU_USER);
  TAU_DYNAMIC_TIMER_START(timer);
  ...
  TAU_PROFILE_STOP(timer);
  return a;
}
Fortran :
integer tau_iteration / 0 /
      save tau_iteration
      call TAU_PROFILE_TIMER(profiler, 'FOO1 [{foo.f90} {16,18}]')
      call TAU_PROFILE_START(profiler)
      print *, "inside foo1: calling bar, x = ", x
      tau_iteration = tau_iteration + 1
  call TAU_DYNAMIC_TIMER_START(tau_iteration,"foo1_bar");
        call bar(x-1)
      print *, "after calling bar"
       call TAU_DYNAMIC_TIMER_STOP(tau_iteration,"foo1_bar");
  call TAU_PROFILE_STOP(profiler)
10.16. TAU_PROFILE_TIMER_DYNAMIC
Defines a dynamic timer.
C/C++:
      TAU_PROFILE_TIMER_DYNAMIC
      Profiler timer
      char* or string& function_name
      char* or string& type
      TauGroup_t group
Fortran:
TAU_PROFILE_TIMER_DYNAMIC
integer profiler(2)
character name(size)TAU_PROFILE_TIMER_DYNAMIC operates similar to TAU_PROFILE_TIMER except that the timer is created each time the statement is invoked. This way, the name of the timer can be different for each execution.
C/C++ :
int main(int argc, char **argv) {
  int i;
  TAU_PROFILE_TIMER(t,"main()", "", TAU_DEFAULT);
  TAU_PROFILE_SET_NODE(0);
  TAU_PROFILE_START(t);

  for (i=0; i&5; i++) {
    char buf[32];
    sprintf(buf, "Iteration %d", i);

    TAU_PROFILE_TIMER_DYNAMIC(timer, buf, "", TAU_USER);
    TAU_PROFILE_START(timer);
    printf("Iteration %d\n", i);
    f1();

    TAU_PROFILE_STOP(timer);
  }
  return 0;
}
Fortran :
subroutine ITERATION(val)
  integer val
  character(13) cvar
  integer profiler(2) / 0, 0 /
  save profiler

  print *, "Iteration ", val

  write (cvar,'(a9,i2)') 'Iteration', val
  call TAU_PROFILE_TIMER_DYNAMIC(profiler, cvar)
  call TAU_PROFILE_START(profiler)

  call F1()
  call TAU_PROFILE_STOP(profiler)
  return
end
10.17. TAU_PROFILE_DECLARE_TIMER
Declares a timer for C
C:
      TAU_PROFILE_DECLARE_TIMER
Profiler timerBecause C89 does not allow mixed code and declarations, TAU_PROFILE_TIMER can only be used once in a function. To declare two timers in a C function, use TAU_PROFILE_DECLARE_TIMER and TAU_PROFILE_CREATE_TIMER .
C :
int f1(void) {
  TAU_PROFILE_DECLARE_TIMER(t1);
  TAU_PROFILE_DECLARE_TIMER(t2);

  TAU_PROFILE_CREATE_TIMER(t1, "timer1", "", TAU_USER);
  TAU_PROFILE_CREATE_TIMER(t2, "timer2", "", TAU_USER);

  TAU_PROFILE_START(t1);
  ...
  TAU_PROFILE_START(t2);
  ...
  TAU_PROFILE_STOP(t2);
  TAU_PROFILE_STOP(t1);
  return 0;
}
10.18. TAU_PROFILE_CREATE_TIMER
Creates a timer for C
C:
      TAU_PROFILE_CREATE_TIMER
Profiler timerBecause C89 does not allow mixed code and declarations, TAU_PROFILE_TIMER can only be used once in a function. To declare two timers in a C function, use TAU_PROFILE_DECLARE_TIMER and TAU_PROFILE_CREATE_TIMER .
C :
int f1(void) {
  TAU_PROFILE_DECLARE_TIMER(t1);
  TAU_PROFILE_DECLARE_TIMER(t2);

  TAU_PROFILE_CREATE_TIMER(t1, "timer1", "", TAU_USER);
  TAU_PROFILE_CREATE_TIMER(t2, "timer2", "", TAU_USER);

  TAU_PROFILE_START(t1);
  ...
  TAU_PROFILE_START(t2);
  ...
  TAU_PROFILE_STOP(t2);
  TAU_PROFILE_STOP(t1);
  return 0;
}
TAU_PROFILE_DECLARE_TIMER , TAU_PROFILE_START , TAU_PROFILE_STOP
10.19. TAU_GLOBAL_TIMER
Declares a global timer
C/C++:
      TAU_GLOBAL_TIMER
      Profiler timer
      char* or string& function_name
      char* or string& type
TauGroup_t groupAs TAU_PROFILE_TIMER is used within the scope of a block (typically a routine), TAU_GLOBAL_TIMER can be used across different routines.
C/C++ :
/* f1.c */

TAU_GLOBAL_TIMER(globalTimer, "global timer", "", TAU_USER);

/* f2.c */

TAU_GLOBAL_TIMER_EXTERNAL(globalTimer);
int foo(void) {
  TAU_GLOBAL_TIMER_START(globalTimer);
  /* ... */
  TAU_GLOBAL_TIMER_STOP();
}
10.20. TAU_GLOBAL_TIMER_EXTERNAL
Declares a global timer from an external compilation unit
C/C++:
      TAU_GLOBAL_TIMER_EXTERNAL
Profiler timerTAU_GLOBAL_TIMER_EXTERNAL allows you to access a timer defined in another compilation unit.
C/C++ :
/* f1.c */

TAU_GLOBAL_TIMER(globalTimer, "global timer", "", TAU_USER);

/* f2.c */

TAU_GLOBAL_TIMER_EXTERNAL(globalTimer);
int foo(void) {
  TAU_GLOBAL_TIMER_START(globalTimer);
  /* ... */
  TAU_GLOBAL_TIMER_STOP();
}
TAU_GLOBAL_TIMER , TAU_GLOBAL_TIMER_START , TAU_GLOBAL_TIMER_STOP
10.21. TAU_GLOBAL_TIMER_START
Starts a global timer
C/C++:
      TAU_GLOBAL_TIMER_START
Profiler timerTAU_GLOBAL_TIMER_START starts a global timer.
C/C++ :
/* f1.c */

TAU_GLOBAL_TIMER(globalTimer, "global timer", "", TAU_USER);

/* f2.c */

TAU_GLOBAL_TIMER_EXTERNAL(globalTimer);
int foo(void) {
  TAU_GLOBAL_TIMER_START(globalTimer);
  /* ... */
  TAU_GLOBAL_TIMER_STOP();
}
10.22. TAU_GLOBAL_TIMER_STOP
Stops a global timer
C/C++:
TAU_GLOBAL_TIMER_STOPTAU_GLOBAL_TIMER_STOP stops a global timer.
C/C++ :
/* f1.c */

TAU_GLOBAL_TIMER(globalTimer, "global timer", "", TAU_USER);

/* f2.c */

TAU_GLOBAL_TIMER_EXTERNAL(globalTimer);
int foo(void) {
  TAU_GLOBAL_TIMER_START(globalTimer);
  /* ... */
  TAU_GLOBAL_TIMER_STOP();
}
10.23. TAU_PHASE
Profile a C++ function as a phase
TAU_PHASE
      char* or string& function_name
      char* or string& type
TauGroup_t groupTAU_PHASE profiles a function as a phase. This macro defines the function and takes care of the timer start and stop as well. The timer will stop when the macro goes out of scope (as in C++ destruction).
int foo(char *str) {
  TAU_PHASE(foo","int (char *)",TAU_DEFAULT);
  ...
}
10.24. TAU_DYNAMIC_PHASE
Defines a dynamic phase.
C/C++:
      TAU_DYNAMIC_PHASE
      Phase phase
      char* or string& function_name
      char* or string& type
      TauGroup_t group
Fortran:
TAU_DYNAMIC_PHASE
integer phase(2)
character name(size)TAU_DYNAMIC_PHASE creates a dynamic phase. The name of the timer can be different for each execution.
C/C++ :
int main(int argc, char **argv) {
  int i;
  TAU_PROFILE_TIMER(t,"main()", "", TAU_DEFAULT);
  TAU_PROFILE_SET_NODE(0);
  TAU_PROFILE_START(t);

  for (i=0; i&5; i++) {
    char buf[32];
    sprintf(buf, "Iteration %d", i);

    TAU_DYNAMIC_PHASE(timer, buf, "", TAU_USER);
    TAU_PHASE_START(timer);
    printf("Iteration %d\n", i);
    f1();

    TAU_PHASE_STOP(timer);
  }
  return 0;
}
Fortran :
subroutine ITERATION(val)
  integer val
  character(13) cvar
  integer profiler(2) / 0, 0 /
  save profiler

  print *, "Iteration ", val

  write (cvar,'(a9,i2)') 'Iteration', val
  call TAU_DYNAMIC_PHASE(profiler, cvar)
  call TAU_PHASE_START(profiler)

  call F1()
  call TAU_PHASE_STOP(profiler)
  return
end
10.25. TAU_PHASE_CREATE_DYNAMIC
Defines a dynamic phase.
C/C++:
      TAU_PHASE_CREATE_DYNAMIC
      Phase phase
      char* or string& function_name
      char* or string& type
      TauGroup_t group
Fortran:
TAU_PHASE_CREATE_DYNAMIC
integer phase(2)
character name(size)TAU_PHASE_CREATE_DYNAMIC creates a dynamic phase. The name of the timer can be different for each execution.
C/C++ :
int main(int argc, char **argv) {
  int i;
  TAU_PROFILE_TIMER(t,"main()", "", TAU_DEFAULT);
  TAU_PROFILE_SET_NODE(0);
  TAU_PROFILE_START(t);

  for (i=0; i&5; i++) {
    char buf[32];
    sprintf(buf, "Iteration %d", i);

    TAU_PHASE_CREATE_DYNAMIC(timer, buf, "", TAU_USER);
    TAU_PHASE_START(timer);
    printf("Iteration %d\n", i);
    f1();

    TAU_PHASE_STOP(timer);
  }
  return 0;
}
Fortran :
subroutine ITERATION(val)
  integer val
  character(13) cvar
  integer profiler(2) / 0, 0 /
  save profiler

  print *, "Iteration ", val

  write (cvar,'(a9,i2)') 'Iteration', val
  call TAU_PHASE_CREATE_DYNAMIC(profiler, cvar)
  call TAU_PHASE_START(profiler)

  call F1()
  call TAU_PHASE_STOP(profiler)
  return
end
10.26. TAU_PHASE_CREATE_STATIC
Defines a static phase.
C/C++:
      TAU_PHASE_CREATE_STATIC
      Phase phase
      char* or string& function_name
      char* or string& type
      TauGroup_t group
Fortran:
TAU_PHASE_CREATE_STATIC
integer phase(2)
character name(size)TAU_PHASE_CREATE_STATIC creates a static phase. Static phases (and timers) are more efficient than dynamic ones because the function registration only takes place once.
C/C++ :
int f2(void)
{
  TAU_PHASE_CREATE_STATIC(t2,"IO Phase", "", TAU_USER);
  TAU_PHASE_START(t2);
  input();
  output();
  TAU_PHASE_STOP(t2);
  return 0;
}
Fortran :
subroutine F2()

  integer phase(2) / 0, 0 /
  save    phase

  call TAU_PHASE_CREATE_STATIC(phase,'IO Phase')
  call TAU_PHASE_START(phase)

  call INPUT()
  call OUTPUT()

  call TAU_PHASE_STOP(phase)
end
Python:
import pytau
ptr = pytau.phase("foo")

pytau.start(ptr)
foo(2)
pytau.stop(ptr)
10.27. TAU_PHASE_START
Enters a phase.
C/C++:
      TAU_PHASE_START
      Phase phase
Fortran:
TAU_PHASE_START
integer phase(2)TAU_PHASE_START enters a phase. Phases can be nested, but not overlapped.
C/C++ :
int f2(void)
{
  TAU_PHASE_CREATE_STATIC(t2,"IO Phase", "", TAU_USER);
  TAU_PHASE_START(t2);
  input();
  output();
  TAU_PHASE_STOP(t2);
  return 0;
}
Fortran :
subroutine F2()

  integer phase(2) / 0, 0 /
  save    phase

  call TAU_PHASE_CREATE_STATIC(phase,'IO Phase')
  call TAU_PHASE_START(phase)

  call INPUT()
  call OUTPUT()

  call TAU_PHASE_STOP(phase)
end
10.28. TAU_PHASE_STOP
Exits a phase.
C/C++:
      TAU_PHASE_STOP
      Phase phase
Fortran:
TAU_PHASE_STOP
integer phase(2)TAU_PHASE_STOP exits a phase. Phases can be nested, but not overlapped.
C/C++ :
int f2(void)
{
  TAU_PHASE_CREATE_STATIC(t2,"IO Phase", "", TAU_USER);
  TAU_PHASE_START(t2);
  input();
  output();
  TAU_PHASE_STOP(t2);
  return 0;
}
Fortran :
subroutine F2()

  integer phase(2) / 0, 0 /
  save    phase

  call TAU_PHASE_CREATE_STATIC(phase,'IO Phase')
  call TAU_PHASE_START(phase)

  call INPUT()
  call OUTPUT()

  call TAU_PHASE_STOP(phase)
end
10.29. TAU_DYNAMIC_PHASE_START
Enters a DYNAMIC_PHASE.
C/C++:
      TAU_DYNAMIC_PHASE_START
      string name
Fortran:
TAU_DYNAMIC_PHASE_START
char name(size)TAU_DYNAMIC_PHASE_START enters a DYNAMIC phase. Phases can be nested, but not overlapped.
C/C++ :
TAU_PROFILE("int foo(int) [{foo.cpp} {13,1}-{20,1}]", " ", TAU_USER);

printf("inside foo: calling bar: x = %d\n", x);
printf("before calling bar in foo\n");
TAU_DYNAMIC_PHASE_START("foo_bar");
bar(x-1); /* 17 */
printf("after calling bar in foo\n");
TAU_DYNAMIC_PHASE_STOP("foo_bar");
return x;
Fortran :
call TAU_PROFILE_TIMER(profiler, 'FOO [{foo.f90} {8,18}]')
    call TAU_PROFILE_START(profiler)
    print *, "inside foo: calling bar, x = ", x
     call TAU_DYNAMIC_PHASE_START("foo_bar");
      call bar(x-1)
    print *, "after calling bar"
     call TAU_DYNAMIC_PHASE_STOP("foo_bar");
call TAU_PROFILE_STOP(profiler)
10.30. TAU_DYNAMIC_PHASE_STOP
Enters a DYNAMIC_PHASE.
C/C++:
      TAU_DYNAMIC_PHASE_STOP
      string name
Fortran:
TAU_DYNAMIC_PHASE_STOP
char name(size)TAU_DYNAMIC_PHASE_STOP leaves a DYNAMIC phase. Phases can be nested, but not overlapped.
C/C++ :
TAU_PROFILE("int foo(int) [{foo.cpp} {13,1}-{20,1}]", " ", TAU_USER);

printf("inside foo: calling bar: x = %d\n", x);
printf("before calling bar in foo\n");
TAU_DYNAMIC_PHASE_START("foo_bar");
bar(x-1); /* 17 */
printf("after calling bar in foo\n");
TAU_DYNAMIC_PHASE_STOP("foo_bar");
return x;
Fortran :
call TAU_PROFILE_TIMER(profiler, 'FOO [{foo.f90} {8,18}]')
    call TAU_PROFILE_START(profiler)
    print *, "inside foo: calling bar, x = ", x
     call TAU_DYNAMIC_PHASE_START("foo_bar");
      call bar(x-1)
    print *, "after calling bar"
     call TAU_DYNAMIC_PHASE_STOP("foo_bar");
call TAU_PROFILE_STOP(profiler)
10.31. TAU_STATIC_PHASE_START
Enters a STATIC_PHASE.
C/C++:
      TAU_STATIC_PHASE_START
      string name
Fortran:
TAU_STATIC_PHASE_START
char name(size)TAU_STATIC_PHASE_START enters a static phase. Phases can be nested, but not overlapped.
C/C++ :
TAU_PROFILE("int foo(int) [{foo.cpp} {13,1}-{20,1}]", " ", TAU_USER);

printf("inside foo: calling bar: x = %d\n", x);
printf("before calling bar in foo\n");
TAU_STATIC_PHASE_START("foo_bar");
bar(x-1); /* 17 */
printf("after calling bar in foo\n");
TAU_STATIC_PHASE_STOP("foo_bar");
return x;
Fortran :
call TAU_PROFILE_TIMER(profiler, 'FOO [{foo.f90} {8,18}]')
    call TAU_PROFILE_START(profiler)
    print *, "inside foo: calling bar, x = ", x
     call TAU_STATIC_PHASE_START("foo_bar");
      call bar(x-1)
    print *, "after calling bar"
     call TAU_STATIC_PHASE_STOP("foo_bar");
call TAU_PROFILE_STOP(profiler)
10.32. TAU_STATIC_PHASE_STOP
Enters a STATIC_PHASE.
C/C++:
      TAU_STATIC_PHASE_STOP
      string name
Fortran:
TAU_STATIC_PHASE_STOP
char name(size)TAU_STATIC_PHASE_STOP leaves a static phase. Phases can be nested, but not overlapped.
C/C++ :
TAU_PROFILE("int foo(int) [{foo.cpp} {13,1}-{20,1}]", " ", TAU_USER);

printf("inside foo: calling bar: x = %d\n", x);
printf("before calling bar in foo\n");
TAU_STATIC_PHASE_START("foo_bar");
bar(x-1); /* 17 */
printf("after calling bar in foo\n");
TAU_STATIC_PHASE_STOP("foo_bar");
return x;
Fortran :
call TAU_PROFILE_TIMER(profiler, 'FOO [{foo.f90} {8,18}]')
    call TAU_PROFILE_START(profiler)
    print *, "inside foo: calling bar, x = ", x
     call TAU_STATIC_PHASE_START("foo_bar");
      call bar(x-1)
    print *, "after calling bar"
     call TAU_STATIC_PHASE_STOP("foo_bar");
call TAU_PROFILE_STOP(profiler)
10.33. TAU_GLOBAL_PHASE
Declares a global phase
C/C++:
      TAU_GLOBAL_PHASE
      Phase phase
      char* or string& function_name
      char* or string& type
TauGroup_t groupDeclares a global phase to be used in multiple compilation units.
C/C++ :
/* f1.c */

TAU_GLOBAL_PHASE(globalPhase, "global phase", "", TAU_USER);

/* f2.c */

int bar(void) {
  TAU_GLOBAL_PHASE_START(globalPhase);
  /* ... */
  TAU_GLOBAL_PHASE_STOP(globalPhase);
}
10.34. TAU_GLOBAL_PHASE_EXTERNAL
Declares a global phase from an external compilation unit
C/C++:
      TAU_GLOBAL_PHASE_EXTERNAL
Profiler timerTAU_GLOBAL_PHASE_EXTERNAL allows you to access a phase defined in another compilation unit.
C/C++ :
/* f1.c */

TAU_GLOBAL_PHASE(globalPhase, "global phase", "", TAU_USER);

/* f2.c */

int bar(void) {
  TAU_GLOBAL_PHASE_START(globalPhase);
  /* ... */
  TAU_GLOBAL_PHASE_STOP(globalPhase);
}
TAU_GLOBAL_PHASE , TAU_GLOBAL_PHASE_START , TAU_GLOBAL_PHASE_STOP
10.35. TAU_GLOBAL_PHASE_START
Starts a global phase
C/C++:
      TAU_GLOBAL_PHASE_START
Phase phaseTAU_GLOBAL_PHASE_START starts a global phase.
C/C++ :
/* f1.c */

TAU_GLOBAL_PHASE(globalPhase, "global phase", "", TAU_USER);

/* f2.c */

int bar(void) {
  TAU_GLOBAL_PHASE_START(globalPhase);
  /* ... */
  TAU_GLOBAL_PHASE_STOP(globalPhase);
}
10.36. TAU_GLOBAL_PHASE_STOP
Stops a global phase
C/C++:
      TAU_GLOBAL_PHASE_STOP
Phase phaseTAU_GLOBAL_PHASE_STOP stops a global phase.
C/C++ :
/* f1.c */

TAU_GLOBAL_PHASE(globalPhase, "global phase", "", TAU_USER);

/* f2.c */

int bar(void) {
  TAU_GLOBAL_PHASE_STOP(globalPhase);
  /* ... */
  TAU_GLOBAL_PHASE_STOP(globalPhase);
}
10.37. TAU_PROFILE_EXIT
Alerts the profiling system to an exit call
C/C++:
      TAU_PROFILE_EXIT
      const char * message
Fortran:
TAU_PROFILE_EXIT
character message(size)TAU_PROFILE_EXIT should be called prior to an error exit from the program so that any profiles or event traces can be dumped to disk before quitting.
C/C++ :
if ((ret = open(...)) < 0) {
  TAU_PROFILE_EXIT("ERROR in opening a file");
  perror("open() failed");
  exit(1);
}
Fortran :
call TAU_PROFILE_EXIT('abort called')
10.38. TAU_REGISTER_THREAD
Register a thread with the profiling system
C/C++:
      TAU_REGISTER_THREAD
Fortran:
TAU_REGISTER_THREADTo register a thread with the profiling system, invoke the TAU_REGISTER_THREAD macro in the run method of the thread prior to executing any other TAU macro. This sets up thread identifiers that are later used by the instrumentation system.
C/C++ :
void * threaded_func(void *data) {
  TAU_REGISTER_THREAD();
  { /**** NOTE WE START ANOTHER BLOCK IN THREAD */
    TAU_PROFILE_TIMER(tautimer, "threaded_func()", "int ()",
                      TAU_DEFAULT);
    TAU_PROFILE_START(tautimer);
    work(); /* work done by this thread */
    TAU_PROFILE_STOP(tautimer);
  }
  return NULL;
}
Fortran :
call TAU_REGISTER_THREAD()
PDT based tau_instrumentor does not insert TAU_REGISTER_THREAD calls, they must be inserted manually
10.39. TAU_PROFILE_GET_NODE
Returns the measurement system’s node id
C/C++:
      TAU_PROFILE_GET_NODE
      int node
Fortran:
TAU_PROFILE_GET_NODE
integer nodeTAU_PROFILE_GET_NODE gives the node id for the processes in which it is called. When using MPI node id is the same as MPI rank.
C/C++ :
int main (int argc, char **argv) {
	int nodeid;
  TAU_PROFILE_GET_NODE(nodeid);
  return 0;
}
Fortran :
PROGRAM SUM_OF_CUBES
INTEGER :: N
call TAU_PROFILE_GET_NODE(N)
END PROGRAM SUM_OF_CUBES
Python:
import pytau pytau.setNode(0)
10.40. TAU_PROFILE_GET_CONTEXT
Gives the measurement system’s context id
C/C++:
TAU_PROFILE_GET_CONTEXT
int contextFortran:
TAU_PROFILE_GET_CONTEXT
integer contextTAU_PROFILE_GET_CONTEXT gives the context id for the processes in which it is called.
C/C++ :
int main (int argc, char **argv) {
int i;
TAU_PROFILE_GET_CONTEXT(i);
return 0;
}
Fortran :
PROGRAM SUM_OF_CUBES
INTEGER :: C
call TAU_PROFILE_GET_CONTEXT(C)
END PROGRAM SUM_OF_CUBES
10.41. TAU_PROFILE_SET_THREAD
Informs the measurement system of the THREAD id
C/C++:
TAU_PROFILE_SET_THREAD
int THREADFortran:
TAU_PROFILE_SET_THREAD
integer THREADThe TAU_PROFILE_SET_THREAD macro sets the thread identifier of the executing task for profiling and tracing. Tasks are identified using node, context and thread ids. The profile data files generated will accordingly be named profile.<THREAD>.<context>.<thread>. Note that it is not necessary to call TAU_PROFILE_SET_THREAD when you configued with a threading package (including OpenMP).
C/C++ :
int main (int argc, char **argv) {
int ret, i;
pthread_attr_t attr;
pthread_t tid;
TAU_PROFILE_TIMER(tautimer,"main()", "int (int, char **)",
TAU_DEFAULT);
TAU_PROFILE_START(tautimer);
TAU_PROFILE_INIT(argc, argv);
TAU_PROFILE_SET_THREAD(0);
/* ... */
TAU_PROFILE_STOP(tautimer);
return 0;
}
Fortran :
PROGRAM SUM_OF_CUBES
integer profiler(2) / 0, 0 /
save profiler
INTEGER :: H, T, U
call TAU_PROFILE_INIT()
call TAU_PROFILE_TIMER(profiler, 'PROGRAM SUM_OF_CUBES')
call TAU_PROFILE_START(profiler)
call TAU_PROFILE_SET_THREAD(0)
! This program prints all 3-digit numbers that
! equal the sum of the cubes of their digits.
DO H = 1, 9
DO T = 0, 9
DO U = 0, 9
IF (100*H + 10*T + U == H**3 + T**3 + U**3) THEN
PRINT "(3I1)", H, T, U
ENDIF
END DO
END DO
END DO
call TAU_PROFILE_STOP(profiler)
END PROGRAM SUM_OF_CUBES
Python:
import pytau pytau.setThread(0)
10.42. TAU_PROFILE_GET_THREAD
Gives the measurement system’s thread id
C/C++:
TAU_PROFILE_GET_THREAD
int threadFortran:
TAU_PROFILE_GET_THREAD
integer THREADTAU_PROFILE_GET_THREAD gives the thread id for the processes in which it is called.
C/C++ :
int main (int argc, char **argv) {
int i;
TAU_PROFILE_GET_THREAD(i);
return 0;
}
Fortran :
PROGRAM SUM_OF_CUBES
INTEGER :: T
call TAU_PROFILE_GET_THREAD(T)
! This program prints all 3-digit numbers that
! equal the sum of the cubes of their digits.
END PROGRAM SUM_OF_CUBES
Python:
import pytau pytau.getThread(i)
10.43. TAU_PROFILE_SET_NODE
Informs the measurement system of the node id
C/C++:
TAU_PROFILE_SET_NODE
int nodeFortran:
TAU_PROFILE_SET_NODE
integer nodeThe TAU_PROFILE_SET_NODE macro sets the node identifier of the executing task for profiling and tracing. Tasks are identified using node, context and thread ids. The profile data files generated will accordingly be named profile.<node>.<context>.<thread>. Note that it is not necessary to call TAU_PROFILE_SET_NODE when using the TAU MPI wrapper library.
C/C++ :
int main (int argc, char **argv) {
int ret, i;
pthread_attr_t attr;
pthread_t tid;
TAU_PROFILE_TIMER(tautimer,"main()", "int (int, char **)",
TAU_DEFAULT);
TAU_PROFILE_START(tautimer);
TAU_PROFILE_INIT(argc, argv);
TAU_PROFILE_SET_NODE(0);
/* ... */
TAU_PROFILE_STOP(tautimer);
return 0;
}
Fortran :
PROGRAM SUM_OF_CUBES
integer profiler(2) / 0, 0 /
save profiler
INTEGER :: H, T, U
call TAU_PROFILE_INIT()
call TAU_PROFILE_TIMER(profiler, 'PROGRAM SUM_OF_CUBES')
call TAU_PROFILE_START(profiler)
call TAU_PROFILE_SET_NODE(0)
! This program prints all 3-digit numbers that
! equal the sum of the cubes of their digits.
DO H = 1, 9
DO T = 0, 9
DO U = 0, 9
IF (100*H + 10*T + U == H**3 + T**3 + U**3) THEN
PRINT "(3I1)", H, T, U
ENDIF
END DO
END DO
END DO
call TAU_PROFILE_STOP(profiler)
END PROGRAM SUM_OF_CUBES
Python:
import pytau pytau.setNode(0)
10.44. TAU_PROFILE_SET_CONTEXT
Informs the measurement system of the context id
C/C++:
TAU_PROFILE_SET_CONTEXT
int contextFortran:
TAU_PROFILE_SET_CONTEXT
integer contextThe TAU_PROFILE_SET_CONTEXT macro sets the context identifier of the executing task for profiling and tracing. Tasks are identified using context, context and thread ids. The profile data files generated will accordingly be named profile.<context>.<context>.<thread>. Note that it is not necessary to call TAU_PROFILE_SET_CONTEXT when using the TAU MPI wrapper library.
C/C++ :
int main (int argc, char **argv) {
int ret, i;
pthread_attr_t attr;
pthread_t tid;
TAU_PROFILE_TIMER(tautimer,"main()", "int (int, char **)",
TAU_DEFAULT);
TAU_PROFILE_START(tautimer);
TAU_PROFILE_INIT(argc, argv);
TAU_PROFILE_SET_NODE(0);
TAU_PROFILE_SET_CONTEXT(1);
/* ... */
TAU_PROFILE_STOP(tautimer);
return 0;
}
Fortran :
PROGRAM SUM_OF_CUBES
integer profiler(2) / 0, 0 /
save profiler
INTEGER :: H, T, U
call TAU_PROFILE_INIT()
call TAU_PROFILE_TIMER(profiler, 'PROGRAM SUM_OF_CUBES')
call TAU_PROFILE_START(profiler)
call TAU_PROFILE_SET_NODE(0)
call TAU_PROFILE_SET_CONTEXT(1)
! This program prints all 3-digit numbers that
! equal the sum of the cubes of their digits.
DO H = 1, 9
DO T = 0, 9
DO U = 0, 9
IF (100*H + 10*T + U == H**3 + T**3 + U**3) THEN
PRINT "(3I1)", H, T, U
ENDIF
END DO
END DO
END DO
call TAU_PROFILE_STOP(profiler)
END PROGRAM SUM_OF_CUBES
10.45. TAU_REGISTER_FORK
Informs the measurement system that a fork has taken place
C/C++:
TAU_REGISTER_FORK
int pid
enum TauFork_t optionTo register a child process obtained from the fork() syscall, invoke the TAU_REGISTER_FORK macro. It takes two parameters, the first is the node id of the child process (typically the process id returned by the fork call or any 0..N-1 range integer). The second parameter specifies whether the performance data for the child process should be derived from the parent at the time of fork ( TAU_INCLUDE_PARENT_DATA ) or should be independent of its parent at the time of fork ( TAU_EXCLUDE_PARENT_DATA ). If the process id is used as the node id, before any analysis is done, all profile files should be converted to contiguous node numbers (from 0..N-1). It is highly recommended to use flat contiguous node numbers in this call for profiling and tracing.
C/C++ :
pID = fork();
if (pID == 0) {
printf("Parent : pid returned %d\n", pID)
} else {
// If we'd used the TAU_INCLUDE_PARENT_DATA, we get
// the performance data from the parent in this process
// as well.
TAU_REGISTER_FORK(pID, TAU_EXCLUDE_PARENT_DATA);
printf("Child : pid = %d", pID);
}
10.46. TAU_REGISTER_EVENT
Registers a user event
C/C++:
TAU_REGISTER_EVENT
TauUserEvent variable
char *event_nameFortran:
TAU_REGISTER_EVENT
int variable(2)
character event_name(size)TAU can profile user-defined events using TAU_REGISTER_EVENT . The meaning of the event is determined by the user. The first argument to TAU_REGISTER_EVENT is the pointer to an integer array. This array is declared with a save attribute as shown below.
C/C++ :
int user_square(int count) {
TAU_REGISTER_EVENT(ue1, "UserSquare Event");
TAU_EVENT(ue1, count * count);
return 0;
}
Fortran :
integer eventid(2) save eventid call TAU_REGISTER_EVENT(eventid, 'Error in Iteration') call TAU_EVENT(eventid, count)
10.47. TAU_PROFILER_REGISTER_EVENT
Registers a user event
C/C++:
TAU_PROFILER_REGISTER_EVENT
TauUserEvent variable
void *event
char *event_nameFortran:
TAU_PROFILER_REGISTER_EVENT
int integer (2)
character event_name(size)TAU can profile user-defined events using TAU_PROFILER_REGISTER_EVENT . The meaning of the event is determined by the user. The first argument to TAU_PROFILER_REGISTER_EVENT is the pointer to an integer array. This array is declared with a save attribute as shown below.
C/C++ :
int user_square(int count) {
void *ue1;
TAU_PROFILER_REGISTER_EVENT(ue1, "UserSquare Event");
TAU_EVENT(ue1, count * count);
return 0;
}
Fortran :
integer eventid(2) save eventid call TAU_PROFILER_REGISTER_EVENT(eventid, 'Error in Iteration') call TAU_EVENT(eventid, count)
10.48. TAU_EVENT
Triggers a user event
C/C++:
TAU_TRIGGER_EVENT
const char * name
double valueFortran:
TAU_TRIGGER_EVENT
int integer (2)
character event_name(size)Triggers an named event with the given value
C/C++ :
int user_square(int count) {
TAU_TRIGGER_EVENT("Error in Iteration", count * count);
return 0;
}
Fortran :
call TAU_EVENT(count, 'Error in Iteration')
10.49. TAU_EVENT
Triggers a user event
C/C++:
TAU_TRIGGER_EVENT_THREAD
const char * name
double value
int threadFortran:
TAU_TRIGGER_EVENT_THREAD
int integer (2)
int integer (2)
character event_name(size)Triggers an named event with the given value on a given thead or task.
C/C++ :
int user_square(int count) {
TAU_TRIGGER_EVENT("Error in Iteration", count * count, workTask);
return 0;
}
Fortran :
call TAU_EVENT(count, workTask, 'Error in Iteration')
10.50. TAU_EVENT
Triggers a user event
C/C++:
TAU_EVENT
TauUserEvent variable
double valueFortran:
TAU_EVENT
integer variable(2)
real valueTriggers an event that was registered with TAU_REGISTER_EVENT .
C/C++ :
int user_square(int count) {
TAU_REGISTER_EVENT(ue1, "UserSquare Event");
TAU_EVENT(ue1, count * count);
return 0;
}
Fortran :
integer eventid(2) save eventid call TAU_REGISTER_EVENT(eventid, 'Error in Iteration') call TAU_EVENT(eventid, count)
10.51. TAU_EVENT_THREAD
Triggers a user event on a given thread
C/C++:
TAU_EVENT_THREAD
TauUserEVENT_THREAD variable
double value
int thread idFortran:
TAU_EVENT_THREAD
integer variable(2)
real value
integer thread idTriggers an event that was registered with TAU_REGISTER_EVENT on a given thread.
C/C++ :
int user_square(int count) {
TAU_REGISTER_EVENT(ue1, "UserSquare Event");
TAU_EVENT_THREAD(ue1, count * count, threadid);
return 0;
}
Fortran :
integer eventid(2) save eventid call TAU_REGISTER_EVENT(eventid, 'Error in Iteration') call TAU_EVENT_THREAD(eventid, count, threadid)
10.52. TAU_REGISTER_CONTEXT_EVENT
Registers a context event
C/C++:
TAU_REGISTER_CONTEXT_EVENT
TauUserEvent variable
char *event_nameFortran:
TAU_REGISTER_CONTEXT_EVENT
int variable(2)
character event_name(size)Creates a context event with name. A context event appends the names of routines executing on the callstack to the name specified by the user. Whenver a context event is triggered, the callstack is examined to determine the context of execution. Starting from the parent function where the event is triggered, TAU walks up the callstack to a depth specified by the user in the environment variable TAU_CALLPATH_DEPTH . If this environment variable is not specified, TAU uses 2 as the default depth. For e.g., if the user registers a context event with the name "memory used" and specifies 3 as the callpath depth, and if the event is triggered in two locations (in routine a, when it was called by b, when it was called by c, and in routine h, when it was called by g, when it was called by i), then, we’d see the user defined event information for "memory used: c() ⇒ b() ⇒ a()" and "memory used: i() ⇒ g() ⇒ h()".
C/C++ :
int f2(void)
{
static int count = 0;
count ++;
TAU_PROFILE("f2()", "(sleeps 2 sec, calls f3)", TAU_USER);
TAU_REGISTER_CONTEXT_EVENT(event, "Iteration count");
/*
if (count == 2)
TAU_DISABLE_CONTEXT_EVENT(event);
*/
printf("Inside f2: sleeps 2 sec, calls f3\n");
TAU_CONTEXT_EVENT(event, 232+count);
sleep(2);
f3();
return 0;
}
Fortran :
subroutine foo(id) integer id integer profiler(2) / 0, 0 / integer maev(2) / 0, 0 / integer mdev(2) / 0, 0 / save profiler, maev, mdev integer :: ierr integer :: h, t, u INTEGER, ALLOCATABLE :: STORAGEARY(:) DOUBLEPRECISION edata call TAU_PROFILE_TIMER(profiler, 'FOO') call TAU_PROFILE_START(profiler) call TAU_PROFILE_SET_NODE(0) call TAU_REGISTER_CONTEXT_EVENT(maev, "STORAGEARY Alloc [cubes.f:20]") call TAU_REGISTER_CONTEXT_EVENT(mdev, "STORAGEARY Dealloc [cubes.f:37]") allocate(STORAGEARY(1:999), STAT=IERR) edata = SIZE(STORAGEARY)*sizeof(INTEGER) call TAU_CONTEXT_EVENT(maev, edata) ... deallocate(STORAGEARY) edata = SIZE(STORAGEARY)*sizeof(INTEGER) call TAU_CONTEXT_EVENT(mdev, edata) call TAU_PROFILE_STOP(profiler) end subroutine foo
10.53. TAU_CONTEXT_EVENT
Triggers a context event
C/C++:
TAU_CONTEXT_EVENT
TauUserEvent variable
double valueFortran:
TAU_CONTEXT_EVENT
integer variable(2)
real valueTriggers a context event. A context event associates the name with the list of routines along the callstack. A context event tracks information like a user defined event and TAU records the maxima, minima, mean, std. deviation and the number of samples for each context event. A context event helps distinguish the data supplied by the user based on the location where an event occurs and the sequence of actions (routine/timer invocations) that preceeded the event. The depth of the the callstack embedded in the context event’s name is specified by the user in the environment variable TAU_CALLPATH_DEPTH . If this variable is not specified, TAU uses a default depth of 2.
C/C++ :
int f2(void)
{
static int count = 0;
count ++;
TAU_PROFILE("f2()", "(sleeps 2 sec, calls f3)", TAU_USER);
TAU_REGISTER_CONTEXT_EVENT(event, "Iteration count");
/*
if (count == 2)
TAU_DISABLE_CONTEXT_EVENT(event);
*/
printf("Inside f2: sleeps 2 sec, calls f3\n");
TAU_CONTEXT_EVENT(event, 232+count);
sleep(2);
f3();
return 0;
}
Fortran :
integer memevent(2) / 0, 0 / save memevent call TAU_REGISTER_CONTEXT_EVENT(memevent, "STORAGEARY mem allocated') call TAU_CONTEXT_EVENT(memevent, SIZEOF(STORAGEARY)*sizeof(INTEGER))
10.54. TAU_TRIGGER_CONTEXT_EVENT
Triggers a context event
C/C++:
TAU_TRIGGER_CONTEXT_EVENT
const char * name
double valueFortran:
TAU_TRIGGER_CONTEXT_EVENT
real value
character event_name(size)Triggers an event with a name and the list of routines along the callstack. A context event tracks information like a user defined event and TAU records the maxima, minima, mean, std. deviation and the number of samples for each context event. A context event helps distinguish the data supplied by the user based on the location where an event occurs and the sequence of actions (routine/timer invocations) that preceeded the event. The depth of the the callstack embedded in the context event’s name is specified by the user in the environment variable TAU_CALLPATH_DEPTH . If this variable is not specified, TAU uses a default depth of 2.
C/C++ :
int f2(void)
{
static int count = 0;
count ++;
TAU_PROFILE("f2()", "(sleeps 2 sec, calls f3)", TAU_USER);
/*
if (count == 2)
TAU_DISABLE_CONTEXT_EVENT(event);
*/
printf("Inside f2: sleeps 2 sec, calls f3\n");
TAU_TRIGGER_CONTEXT_EVENT("Iteration count", 232+count);
sleep(2);
f3();
return 0;
}
Fortran :
integer memevent(2) / 0, 0 / save memevent call TAU_TRIGGER_CONTEXT_EVENT(memevent, SIZEOF(STORAGEARY)*sizeof(INTEGER), "STORAGEARY mem allocated")
10.55. TAU_EVENT
Triggers a context user event
C/C++:
TAU_TRIGGER_CONTEXT_EVENT_THREAD
const char * name
double value
int threadFortran:
TAU_TRIGGER_CONTEXT_EVENT_THREAD
int integer (2)
int integer (2)
character event_name(size)Triggers an event with a name and the list of routines along the callstack. A context event tracks information like a user defined event and TAU records the maxima, minima, mean, std. deviation and the number of samples for each context event. A context event helps distinguish the data supplied by the user based on the location where an event occurs and the sequence of actions (routine/timer invocations) that preceeded the event. The depth of the the callstack embedded in the context event’s name is specified by the user in the environment variable TAU_CALLPATH_DEPTH . If this variable is not specified, TAU uses a default depth of 2.
C/C++ :
int user_square(int count) {
TAU_TRIGGER_CONTEXT_EVENT_THREAD("Error in Iteration", count * count, workTask);
return 0;
}
Fortran :
call TAU_TRIGGER_CONTEXT_EVENT_THREAD(count, workTask, 'Error in Iteration')
10.56. TAU_ENABLE_CONTEXT_EVENT
Enable a context event
C/C++:
TAU_ENABLE_CONTEXT_EVENT
TauUserEvent eventEnables a context event.
C/C++ :
int f2(void) {
static int count = 0;
count ++;
TAU_PROFILE("f2()", "(sleeps 2 sec, calls f3)", TAU_USER);
TAU_REGISTER_CONTEXT_EVENT(event, "Iteration count");
if (count == 2)
TAU_DISABLE_CONTEXT_EVENT(event);
else
TAU_ENABLE_CONTEXT_EVENT(event);
printf("Inside f2: sleeps 2 sec, calls f3\n");
TAU_CONTEXT_EVENT(event, 232+count);
sleep(2);
f3();
return 0;
}
10.57. TAU_DISABLE_CONTEXT_EVENT
Disable a context event
C/C++:
TAU_DISABLE_CONTEXT_EVENT
TauUserEvent eventDisables a context event.
C/C++ :
int f2(void) {
static int count = 0;
count ++;
TAU_PROFILE("f2()", "(sleeps 2 sec, calls f3)", TAU_USER);
TAU_REGISTER_CONTEXT_EVENT(event, "Iteration count");
if (count == 2)
TAU_DISABLE_CONTEXT_EVENT(event);
else
TAU_ENABLE_CONTEXT_EVENT(event);
printf("Inside f2: sleeps 2 sec, calls f3\n");
TAU_CONTEXT_EVENT(event, 232+count);
sleep(2);
f3();
return 0;
}
10.58. TAU_EVENT_SET_NAME
Sets the name of an event
C/C++:
TAU_EVENT_SET_NAME
TauUserEvent event
const char *nameChanges the name of an event.
C/C++ :
TAU_EVENT_SET_NAME(event, "new name");
10.59. TAU_EVENT_DISABLE_MAX
Disables tracking of maximum statistic for a given event
C/C++:
TAU_EVENT_DISABLE_MAX
TauUserEvent eventDisables tracking of maximum statistic for a given event
C/C++ :
TAU_EVENT_DISABLE_MAX(event);
10.60. TAU_EVENT_DISABLE_MEAN
Disables tracking of mean statistic for a given event
C/C++:
TAU_EVENT_DISABLE_MEAN
TauUserEvent eventDisables tracking of mean statistic for a given event
C/C++ :
TAU_EVENT_DISABLE_MEAN(event);
10.61. TAU_EVENT_DISABLE_MIN
Disables tracking of minimum statistic for a given event
C/C++:
TAU_EVENT_DISABLE_MIN
TauUserEvent eventDisables tracking of minimum statistic for a given event
C/C++ :
TAU_EVENT_DISABLE_MIN(event);
10.62. TAU_EVENT_DISABLE_STDDEV
Disables tracking of standard deviation statistic for a given event
C/C++:
TAU_EVENT_DISABLE_STDDEV
TauUserEvent eventDisables tracking of standard deviation statistic for a given event
C/C++ :
TAU_EVENT_DISABLE_STDDEV(event);
10.63. TAU_REPORT_STATISTICS
Outputs statistics
C/C++:
TAU_REPORT_STATISTICSFortran:
TAU_REPORT_STATISTICSTAU_REPORT_STATISTICS prints the aggregate statistics of user events across all threads in each node. Typically, this should be called just before the main thread exits.
C/C++ :
TAU_REPORT_STATISTICS();
Fortran :
call TAU_REPORT_STATISTICS()
10.64. TAU_REPORT_THREAD_STATISTICS
Outputs statistics, plus thread statistics
C/C++:
TAU_REPORT_THREAD_STATISTICSFortran:
TAU_REPORT_THREAD_STATISTICSTAU_REPORT_THREAD_STATISTICS prints the aggregate, as well as per thread user event statistics. Typically, this should be called just before the main thread exits.
C/C++ :
TAU_REPORT_THREAD_STATISTICS();
Fortran :
call TAU_REPORT_THREAD_STATISTICS()
10.65. TAU_ENABLE_INSTRUMENTATION
Enables instrumentation
C/C++:
TAU_ENABLE_INSTRUMENTATIONFortran:
TAU_ENABLE_INSTRUMENTATIONTAU_ENABLE_INSTRUMENTATION macro re-enables all TAU instrumentation. All instances of functions and statements that occur between the disable/enable section are ignored by TAU. This allows a user to limit the trace size, if the macros are used to disable recording of a set of iterations that have the same characteristics as, for example, the first recorded instance.
C/C++ :
int main(int argc, char **argv) {
foo();
TAU_DISABLE_INSTRUMENTATION();
for (int i =0; i < N; i++) {
bar(); // not recorded
}
TAU_ENABLE_INSTRUMENTATION();
bar(); // recorded
}
Fortran :
call TAU_DISABLE_INSTRUMENTATION() ... call TAU_ENABLE_INSTRUMENTATION()
Python:
import pytau pytau.enableInstrumentation() ... pytau.disableInstrumentation()
TAU_DISABLE_INSTRUMENTATION , TAU_ENABLE_GROUP , TAU_DISABLE_GROUP , TAU_INIT , TAU_PROFILE_INIT
10.66. TAU_DISABLE_INSTRUMENTATION
Disables instrumentation
C/C++:
TAU_DISABLE_INSTRUMENTATIONFortran:
TAU_DISABLE_INSTRUMENTATIONTAU_DISABLE_INSTRUMENTATION macro disables all entry/exit instrumentation within all threads of a context. This allows the user to selectively enable and disable instrumentation in parts of his/her code. It is important to re-enable the instrumentation within the same basic block and scope.
C/C++ :
int main(int argc, char **argv) {
foo();
TAU_DISABLE_INSTRUMENTATION();
for (int i =0; i < N; i++) {
bar(); // not recorded
}
TAU_DISABLE_INSTRUMENTATION();
bar(); // recorded
}
Fortran :
call TAU_DISABLE_INSTRUMENTATION() ... call TAU_DISABLE_INSTRUMENTATION()
Python:
import pytau pytau.enableInstrumentation() ... pytau.disableInstrumentation()
TAU_ENABLE_INSTRUMENTATION , TAU_ENABLE_GROUP , TAU_DISABLE_GROUP , TAU_INIT , TAU_PROFILE_INIT
10.67. TAU_ENABLE_GROUP
Enables tracking of a given group
C/C++:
TAU_ENABLE_GROUP
TauGroup_t groupFortran:
TAU_ENABLE_GROUP
integer groupEnables the instrumentation for a given group. By default, it is already on.
C/C++ :
void foo() {
TAU_PROFILE("foo()", " ", TAU_USER);
...
TAU_ENABLE_GROUP(TAU_USER);
}
Fortran :
include 'Profile/TauFAPI.h' call TAU_ENABLE_GROUP(TAU_USER)
Python:
import pytau pytau.enableGroup(TAU_USER)
10.68. TAU_DISABLE_GROUP
Disables tracking of a given group
C/C++:
TAU_DISABLE_GROUP
TauGroup_t groupFortran:
TAU_DISABLE_GROUP
integer groupDisables the instrumentation for a given group. By default, it is on.
C/C++ :
void foo() {
TAU_PROFILE("foo()", " ", TAU_USER);
...
TAU_DISABLE_GROUP(TAU_USER);
}
Fortran :
include 'Profile/TauFAPI.h' call TAU_DISABLE_GROUP(TAU_USER)
Python:
import pytau pytau.disableGroup(TAU_USER)
10.69. TAU_PROFILE_TIMER_SET_GROUP
Change the group of a timer
C/C++:
TAU_PROFILE_TIMER_SET_GROUP
Profiler timer
TauGroup_t groupTAU_PROFILE_TIMER_SET_GROUP changes the group associated with a timer.
C/C++ :
void foo() {
TAU_PROFILE_TIMER(t, "foo loop timer", " ", TAU_USER1);
...
TAU_PROFILE_TIMER_SET_GROUP(t, TAU_USER3);
}
10.70. TAU_PROFILE_TIMER_SET_GROUP_NAME
Changes the group name for a timer
C/C++:
TAU_PROFILE_TIMER_SET_GROUP_NAME
Profiler timer
char *groupnameTAU_PROFILE_TIMER_SET_GROUP_NAME changes the group name associated with a given timer.
C/C++ :
void foo() {
TAU_PROFILE_TIMER(looptimer, "foo: loop1", " ", TAU_USER);
TAU_PROFILE_START(looptimer);
for (int i = 0; i < N; i++) { /* do something */ }
TAU_PROFILE_STOP(looptimer);
TAU_PROFILE_TIMER_SET_GROUP_NAME("Field");
}
10.71. TAU_PROFILE_TIMER_SET_NAME
Changes the name of a timer
C/C++:
TAU_PROFILE_TIMER_SET_NAME
Profiler timer
string newnameTAU_PROFILE_TIMER_SET_NAME macro changes the name associated with a timer to the newname argument.
C/C++ :
void foo() {
TAU_PROFILE_TIMER(timer1, "foo:loop1", " ", TAU_USER);
...
TAU_PROFILE_TIMER_SET_NAME(timer1, "foo:lines 21-34");
}
10.72. TAU_PROFILE_TIMER_SET_TYPE
Changes the type of a timer
C/C++:
TAU_PROFILE_TIMER_SET_TYPE
Profiler timer
string newnameTAU_PROFILE_TIMER_SET_TYPE macro changes the type associated with a timer to the newname argument.
C/C++ :
void foo() {
TAU_PROFILE_TIMER(timer1, "foo", "int", TAU_USER);
...
TAU_PROFILE_TIMER_SET_TYPE(timer1, "long");
}
10.73. TAU_PROFILE_SET_GROUP_NAME
Changes the group name of a profiled section
C/C++:
TAU_PROFILE_SET_GROUP_NAME
char *groupnameTAU_PROFILE_SET_GROUP_NAME macro allows the user to change the group name associated with the instrumented routine. This macro must be called within the instrumented routine.
C/C++ :
void foo() {
TAU_PROFILE("foo()", "void ()", TAU_USER);
TAU_PROFILE_SET_GROUP_NAME("Particle");
/* gives a more meaningful group name */
}
10.74. TAU_INIT
Processes command-line arguments for selective instrumentation
C/C++:
TAU_INIT
int *argc
char ***argvTAU_INIT parses and removes the command-line arguments for the names of profile groups that are to be selectively enabled for instrumentation. By default, if this macro is not used, functions belonging to all profile groups are enabled. TAU_INIT differs from TAU_PROFILE_INIT only in the argument types.
C/C++ :
int main(int argc, char **argv) {
TAU_PROFILE("main()", "int (int, char **)", TAU_GROUP_12);
TAU_INIT(&argc, &argv);
...
}
% ./a.out --profile 12+14
10.75. TAU_PROFILE_INIT
Processes command-line arguments for selective instrumentation
C/C++:
TAU_PROFILE_INIT
int argc
char **argvFortran:
TAU_PROFILE_INITTAU_PROFILE_INIT parses the command-line arguments for the names of profile groups that are to be selectively enabled for instrumentation. By default, if this macro is not used, functions belonging to all profile groups are enabled. TAU_INIT differs from TAU_PROFILE_INIT only in the argument types.
C/C++ :
int main(int argc, char **argv) {
TAU_PROFILE("main()", "int (int, char **)", TAU_DEFAULT);
TAU_PROFILE_INIT(argc, argv);
...
}
% ./a.out --profile 12+14
Fortran :
PROGRAM SUM_OF_CUBES integer profiler(2) save profiler call TAU_PROFILE_INIT() ...
10.76. TAU_GET_PROFILE_GROUP
Creates groups based on names
C/C++:
TAU_GET_PROFILE_GROUP
char *groupnameTAU_GET_PROFILE_GROUP allows the user to dynamically create groups based on strings, rather than use predefined, statically assigned groups such as TAU_USER1, TAU_USER2 etc. This allows names to be associated in creating unique groups that are more meaningful, using names of files or directories for instance.
C/C++ :
#define PARTICLES TAU_GET_PROFILE_GROUP("PARTICLES")
void foo() {
TAU_PROFILE("foo()", " ", PARTICLES);
}
void bar() {
TAU_PROFILE("bar()", " ", PARTICLES);
}
Python:
import pytau
pytau.getProfileGroup("PARTICLES")
10.77. TAU_ENABLE_GROUP_NAME
Enables a group based on name
C/C++:
TAU_ENABLE_GROUP_NAME
char *groupnameFortran:
TAU_ENABLE_GROUP_NAME
character groupname(size)TAU_ENABLE_GROUP_NAME macro can turn on the instrumentation associated with routines based on a dynamic group assigned to them. It is important to note that this and the TAU_DISABLE_GROUP_NAME macros apply to groups created dynamically using TAU_GET_PROFILE_GROUP.
C/C++ :
/* tau_instrumentor was invoked with -g DTM for a set of files */
TAU_DISABLE_GROUP_NAME("DTM");
dtm_routines();
/* disable and then re-enable the group with the name DTM */
TAU_ENABLE_GROUP_NAME("DTM");
Fortran :
! tau_instrumentor was invoked with -g DTM for this file
call TAU_PROFILE_TIMER(profiler, "ITERATE>DTM")
call TAU_DISABLE_GROUP_NAME("DTM")
! Disable, then re-enable DTM group
call TAU_ENABLE_GROUP_NAME("DTM")
Python:
import pytau
pytau.enableGroupName("DTM")
10.78. TAU_DISABLE_GROUP_NAME
Disables a group based on name
C/C++:
TAU_DISABLE_GROUP_NAME
char *groupnameFortran:
TAU_DISABLE_GROUP_NAME
character groupname(size)Similar to TAU_ENABLE_GROUP_NAME , this macro turns off the instrumentation in all routines associated with the dynamic group created using the tau_instrumentor -g <group_name> argument.
C/C++ :
/* tau_instrumentor was invoked with -g DTM for a set of files */
TAU_DISABLE_GROUP_NAME("DTM");
dtm_routines();
/* disable and then re-enable the group with the name DTM */
TAU_ENABLE_GROUP_NAME("DTM");
Fortran :
! tau_instrumentor was invoked with -g DTM for this file
call TAU_PROFILE_TIMER(profiler, "ITERATE>DTM")
call TAU_DISABLE_GROUP_NAME("DTM")
! Disable, then re-enable DTM group
call TAU_ENABLE_GROUP_NAME("DTM")
Python:
import pytau
pytau.disableGroupName("DTM")
10.79. TAU_ENABLE_ALL_GROUPS
Enables instrumentation in all groups
C/C++:
TAU_ENABLE_ALL_GROUPSFortran:
TAU_ENABLE_ALL_GROUPSThis macro turns on instrumentation in all groups
C/C++ :
TAU_ENABLE_ALL_GROUPS();
Fortran :
call TAU_ENABLE_ALL_GROUPS();
Python:
import pytau pytau.enableAllGroups()
10.80. TAU_DISABLE_ALL_GROUPS
Disables instrumentation in all groups
C/C++:
TAU_DISABLE_ALL_GROUPSFortran:
TAU_DISABLE_ALL_GROUPSThis macro turns off instrumentation in all groups.
C/C++ :
void foo() {
TAU_DISABLE_ALL_GROUPS();
TAU_ENABLE_GROUP_NAME("PARTICLES");
}
Fortran :
call TAU_DISABLE_ALL_GROUPS();
Python:
import pytau pytau.disableAllGroups()
10.81. TAU_GET_EVENT_NAMES
Gets the registered user events.
C/C++:
TAU_GET_EVENT_NAMES
const char ***eventList
int *numEventsRetrieves user event names for all user-defined events
C/C++ :
const char **eventList; int numEvents; TAU_GET_EVENT_NAMES(eventList, numEvents); cout << "numEvents: " << numEvents << endl;
10.82. TAU_GET_EVENT_VALS
Gets user event data for given user events.
C/C++:
TAU_GET_EVENT_VALS
const char **inUserEvents
int numUserEvents
int **numEvents
double **max
double **min
double **mean
double **sumSqeRetrieves user defined event data for the specified user defined events. The list of events are specified by the first parameter (eventList) and the user specifies the number of events in the second parameter (numUserEvents). TAU returns the number of times the event was invoked in the numUserEvents. The max, min, mean values are returned in the following parameters. TAU computes the sum of squares of the given event and returns this value in the next argument (sumSqe).
C/C++ :
const char **eventList;
int numEvents;
TAU_GET_EVENT_NAMES(eventList, numEvents);
cout << "numEvents: " << numEvents << endl;
if (numEvents > 0) {
int *numSamples;
double *max;
double *min;
double *mean;
double *sumSqr;
TAU_GET_EVENT_VALS(eventList, numEvents, numSamples,
max, min, mean, sumSqr);
for (int i=0; i<numEvents; i++) {
cout << "-------------------\n";
cout << "User Event: " << eventList[i] << endl;
cout << "Number of Samples: " << numSamples[i] << endl;
cout << "Maximum Value: " << max[i] << endl;
cout << "Minimum Value: " << min[i] << endl;
cout << "Mean Value: " << mean[i] << endl;
cout << "Sum Squared: " << sumSqr[i] << endl;
}
}
}
10.83. TAU_GET_COUNTER_NAMES
Gets the counter names
C/C++:
TAU_GET_COUNTER_NAMES
char **counterList
int numCountersTAU_GET_COUNTER_NAMES returns the list of counter names and the number of counters used for measurement. When wallclock time is used, the counter name of "default" is returned.
C/C++ :
int numOfCounters;
const char ** counterList;
TAU_GET_COUNTER_NAMES(counterList, numOfCounters);
for(int j=0;j<numOfCounters;j++){
cout << "The counter names so far are: " << counterList[j] << endl;
}
Python:
import pytau pytau.getCounterNames(counterList, numOfCounters);
10.84. TAU_GET_FUNC_NAMES
Gets the function names
C/C++:
TAU_GET_FUNC_NAMES
char **functionList
int numFuncsThis macro fills the funcList argument with the list of timer and routine names. It also records the number of routines active in the numFuncs argument.
C/C++ :
const char ** functionList;
int numOfFunctions;
TAU_GET_FUNC_NAMES(functionList, numOfFunctions);
for(int i=0;i<numOfFunctions;i++){
cout << "This function names so far are: " << functionList[i] << endl;
}
Python:
import pytau pytau.getFuncNames(functionList, numOfFunctions)
10.85. TAU_GET_FUNC_VALS
Gets detailed performance data for given functions
C/C++:
TAU_GET_FUNC_VALS
const char **inFuncs
int numOfFuncs
double ***counterExclusiveValues
double ***counterInclusiveValues
int **numOfCalls
int **numOfSubRoutines
const char ***counterNames
int *numOfCounters
int tidIt gets detailed performance data for the list of routines. The user specifies inFuncs and the number of routines; TAU then returns the other arguments with the performance data. counterExclusiveValues and counterInclusiveValues are two dimensional arrays: the first dimension is the routine id and the second is counter id. The value is indexed by these two dimensions. numCalls and numSubrs (or child routines) are one dimensional arrays.
C/C++ :
const char **inFuncs;
/* The first dimension is functions, and the
second dimension is counters */
double **counterExclusiveValues;
double **counterInclusiveValues;
int *numOfCalls;
int *numOfSubRoutines;
const char **counterNames;
int numOfCouns;
TAU_GET_FUNC_NAMES(functionList, numOfFunctions);
/* We are only interested in the first two routines
that are executing in this context. So, we allocate
space for two routine names and get the performance
data for these two routines at runtime. */
if (numOfFunctions >=2 ) {
inFuncs = (const char **) malloc(sizeof(const char *) * 2);
inFuncs[0] = functionList[0];
inFuncs[1] = functionList[1];
//Just to show consistency.
TAU_DB_DUMP();
TAU_GET_FUNC_VALS(inFuncs, 2,
counterExclusiveValues,
counterInclusiveValues,
numOfCalls,
numOfSubRoutines,
counterNames,
numOfCouns);
TAU_DUMP_FUNC_VALS_INCR(inFuncs, 2);
cout << "@@@@@@@@@@@@@@@" << endl;
cout << "The number of counters is: " << numOfCouns << endl;
cout << "The first counter is: " << counterNames[0] << endl;
cout << "The Exclusive value of: " << inFuncs[0]
<< " is: " << counterExclusiveValues[0][0] << endl;
cout << "The numOfSubRoutines of: " << inFuncs[0]
<< " is: " << numOfSubRoutines[0]
<< endl;
cout << "The Inclusive value of: " << inFuncs[1]
<< " is: " << counterInclusiveValues[1][0]
<< endl;
cout << "The numOfCalls of: " << inFuncs[1]
<< " is: " << numOfCalls[1]
<< endl;
cout << "@@@@@@@@@@@@@@@" << endl;
}
TAU_DB_DUMP_INCR();
Python:
import pytau
pytau.dumpFuncVals("foo", "bar", "bar2")
10.86. TAU_ENABLE_TRACKING_MEMORY
Enables memory tracking
C/C++:
TAU_ENABLE_TRACKING_MEMORYFortran:
TAU_ENABLE_TRACKING_MEMORYEnables tracking of the heap memory utilization in the program. TAU takes a sample of the heap memory utilized (as reported by the mallinfo system call) and associates it with a single global user defined event. An interrupt is generated every 10 seconds and the value of the heap memory used is recorded in the user defined event. The inter-interrupt interval (default of 10 seconds) may be set by the user using the call TAU_SET_INTERRUPT_INTERVAL .
C/C++ :
TAU_ENABLE_TRACKING_MEMORY();
Fortran :
call TAU_ENABLE_TRACKING_MEMORY()
Python:
import pytau pytau.enableTrackingMemory()
10.87. TAU_DISABLE_TRACKING_MEMORY
Disables memory tracking
C/C++:
TAU_DISABLE_TRACKING_MEMORYFortran:
TAU_DISABLE_TRACKING_MEMORYDisables tracking of heap memory utilization. This call may be used in sections of code where TAU should not interrupt the execution to periodically track the heap memory utilization.
C/C++ :
TAU_DISABLE_TRACKING_MEMORY();
Fortran :
call TAU_DISABLE_TRACKING_MEMORY()
Python:
import pytau pytau.disableTrackingMemory()
10.88. TAU_TRACK_POWER
Initializes POWER tracking system
C/C++:
TAU_TRACK_POWERFortran:
TAU_TRACK_POWERFor power profiling, there are two modes of operation: 1) the user explicitly inserts TAU_TRACK_POWER_HERE() calls in the source code and the power event is triggered at those locations, and 2) the user enables tracking POWER by calling TAU_TRACK_POWER() and an interrupt is generated every 10 seconds and the POWER event is triggered with the current value. Also, this interrupt interval can be changed by calling TAU_SET_INTERRUPT_INTERVAL(value). The tracking of power events in both cases can be explictly enabled or disabled by calling the macros TAU_ENABLE_TRACKING_POWER() or TAU_DISABLE_TRACKING_() respectively.
C/C++ :
TAU_TRACK_POWER();
Fortran :
call TAU_TRACK_POWER()
Python:
import pytau pytau.trackPower()
10.89. TAU_TRACK_POWER_HERE
Triggers power tracking at a given execution point
C/C++:
TAU_TRACK_POWER_HEREFortran:
TAU_TRACK_POWER_HERETriggers power tracking at a given execution point
C/C++ :
int main(int argc, char **argv) {
TAU_PROFILE("main()", " ", TAU_DEFAULT);
TAU_PROFILE_SET_NODE(0);
TAU_TRACK_POWER_HERE();
int *x = new int[5*1024*1024];
TAU_TRACK_POWER_HERE();
return 0;
}
Fortran :
INTEGER, ALLOCATABLE :: STORAGEARY(:) allocate(STORAGEARY(1:999), STAT=IERR) ! if we wish to record a sample of the heap POWER ! utilization at this point, invoke the following call: call TAU_TRACK_POWER_HERE()
Python:
import pytau pytau.trackPowerHere()
10.90. TAU_ENABLE_TRACKING_POWER
Enables power headroom tracking
C/C++:
TAU_ENABLE_TRACKING_POWERFortran:
TAU_ENABLE_TRACKING_POWERTAU_ENABLE_TRACKING_POWER() enables power tracking after a TAU_DISABLE_TRACKING_POWER() .
C/C++ :
TAU_DISABLE_TRACKING_POWER(); /* do some work */ ... /* re-enable tracking POWER */ TAU_ENABLE_TRACKING_POWER();
Fortran :
call TAU_ENABLE_TRACKING_POWER();
Fortran :
import pytau pytau.enableTrackingPowerHeadroom()
10.91. TAU_DISABLE_TRACKING_POWER
Disables power headroom tracking
C/C++:
TAU_DISABLE_TRACKING_POWERFortran:
TAU_DISABLE_TRACKING_POWERTAU_DISABLE_TRACKING_POWER() disables power tracking.
C/C++ :
TAU_DISABLE_TRACKING_POWER();
Fortran :
call TAU_DISABLE_TRACKING_POWER()
Python:
import pytau pytau.disableTrackingPowerHeadroom()
10.92. TAU_TRACK_MEMORY
Initializes memory tracking system
C/C++:
TAU_TRACK_MEMORYFortran:
TAU_TRACK_MEMORYFor memory profiling, there are two modes of operation: 1) the user explicitly inserts TAU_TRACK_MEMORY_HERE() calls in the source code and the memory event is triggered at those locations, and 2) the user enables tracking memory by calling TAU_TRACK_MEMORY() and an interrupt is generated every 10 seconds and the memory event is triggered with the current value. Also, this interrupt interval can be changed by calling TAU_SET_INTERRUPT_INTERVAL(value). The tracking of memory events in both cases can be explictly enabled or disabled by calling the macros TAU_ENABLE_TRACKING_MEMORY() or TAU_DISABLE_TRACKING_MEMORY() respectively.
C/C++ :
TAU_TRACK_MEMORY();
Fortran :
call TAU_TRACK_MEMORY()
Python:
import pytau pytau.trackMemory()
10.93. TAU_TRACK_MEMORY_HERE
Triggers memory tracking at a given execution point
C/C++:
TAU_TRACK_MEMORY_HEREFortran:
TAU_TRACK_MEMORY_HERETriggers memory tracking at a given execution point
C/C++ :
int main(int argc, char **argv) {
TAU_PROFILE("main()", " ", TAU_DEFAULT);
TAU_PROFILE_SET_NODE(0);
TAU_TRACK_MEMORY_HERE();
int *x = new int[5*1024*1024];
TAU_TRACK_MEMORY_HERE();
return 0;
}
Fortran :
INTEGER, ALLOCATABLE :: STORAGEARY(:) allocate(STORAGEARY(1:999), STAT=IERR) ! if we wish to record a sample of the heap memory ! utilization at this point, invoke the following call: call TAU_TRACK_MEMORY_HERE()
Python:
import pytau pytau.trackMemoryHere()
10.94. TAU_TRACK_MEMORY_FOOTPRINT
Initializes memory footprint tracking system
C/C++:
TAU_TRACK_MEMORY_FOOTPRINTFortran:
TAU_TRACK_MEMORY_FOOTPRINTSimilar to TAU_TRACK_MEMORY but uses the Virtual Memory Resident Set Size (VmRSS) and High Water Mark (VmHWM) to produce an interval event and an atomic event respectively.
C/C++ :
TAU_TRACK_MEMORY_FOOTPRINT();
Fortran :
call TAU_TRACK_MEMORY_FOOTPRINT()
10.95. TAU_TRACK_MEMORY_FOOTPRINT_HERE
Triggers memory footprint tracking at a given execution point
C/C++:
TAU_TRACK_MEMORY_FOOTPRINT_HEREFortran:
TAU_TRACK_MEMORY_FOOTPRINT_HERESimilar to TAU_TRACK_MEMORY_HERE but uses the Virtual Memory Resident Set Size (VmRSS) and High Water Mark (VmHWM) to produce an interval event and an atomic event respectively.
C/C++ :
int main(int argc, char **argv) {
TAU_PROFILE("main()", " ", TAU_DEFAULT);
TAU_PROFILE_SET_NODE(0);
TAU_TRACK_MEMORY_FOOTPRINT_HERE();
int *x = new int[5*1024*1024];
TAU_TRACK_MEMORY_FOOTPRINT_HERE();
return 0;
}
Fortran :
INTEGER, ALLOCATABLE :: STORAGEARY(:) allocate(STORAGEARY(1:999), STAT=IERR) call TAU_TRACK_MEMORY_FOOTPRINT_HERE()
10.96. TAU_ENABLE_TRACKING_MEMORY_HEADROOM
Enables memory headroom tracking
C/C++:
TAU_ENABLE_TRACKING_MEMORY_HEADROOMFortran:
TAU_ENABLE_TRACKING_MEMORY_HEADROOMTAU_ENABLE_TRACKING_MEMORY_HEADROOM() enables memory headroom tracking after a TAU_DISABLE_TRACKING_MEMORY_HEADROOM() .
C/C++ :
TAU_DISABLE_TRACKING_MEMORY_HEADROOM(); /* do some work */ ... /* re-enable tracking memory headroom */ TAU_ENABLE_TRACKING_MEMORY_HEADROOM();
Fortran :
call TAU_ENABLE_TRACKING_MEMORY_HEADROOM();
Fortran :
import pytau pytau.enableTrackingMemoryHeadroom()
10.97. TAU_DISABLE_TRACKING_MEMORY_HEADROOM
Disables memory headroom tracking
C/C++:
TAU_DISABLE_TRACKING_MEMORY_HEADROOMFortran:
TAU_DISABLE_TRACKING_MEMORY_HEADROOMTAU_DISABLE_TRACKING_MEMORY_HEADROOM() disables memory headroom tracking.
C/C++ :
TAU_DISABLE_TRACKING_MEMORY_HEADROOM();
Fortran :
call TAU_DISABLE_TRACKING_MEMORY_HEADROOM()
Python:
import pytau pytau.disableTrackingMemoryHeadroom()
10.98. TAU_TRACK_MEMORY_HEADROOM
Track the headroom (amount of memory for a process to grow) by periodically interrupting the program
C/C++:
TAU_TRACK_MEMORY_HEADROOMFortran:
TAU_TRACK_MEMORY_HEADROOMTracks the amount of memory available for the process before it runs out of free memory on the heap. This call sets up a signal handler that is invoked every 10 seconds by an interrupt (this interval may be altered by using the TAU_SET_INTERRUPT_INTERVAL call). Inside the interrupt handler, TAU evaluates how much memory it can allocate and associates it with the callstack using the TAU context events (See TAU_REGISTER_CONTEXT_EVENT ). The user can vary the size of the callstack by setting the environment variable TAU_CALLPATH_DEPTH (default is 2). This call is useful on machines like IBM BG/L where no virtual memory (or paging using the swap space) is present. The amount of heap memory available to the program is limited by the amount of available physical memory. TAU executes a series of malloc calls with a granularity of 1MB and determines the amount of memory available for the program to grow.
C/C++ :
TAU_TRACK_MEMORY_HEADROOM();
Fortran :
call TAU_TRACK_MEMORY_HEADROOM()
Python:
import pytau pytau.trackMemoryHeadroom()
10.99. TAU_TRACK_MEMORY_HEADROOM_HERE
Takes a sample of the amount of memory available at a given point.
C/C++:
TAU_TRACK_MEMORY_HEADROOM_HEREFortran:
TAU_TRACK_MEMORY_HEADROOM_HEREInstead of relying on a periodic interrupt to track the amount of memory available to grow, this call may be used to take a sample at a given location in the source code. Context events are used to track the amount of memory headroom.
C/C++ :
ary = new double [1024*1024*50]; TAU_TRACK_MEMORY_HEADROOM_HERE();
Fortran :
INTEGER, ALLOCATABLE :: STORAGEARY(:) allocate(STORAGEARY(1:999), STAT=IERR) TAU_TRACK_MEMORY_HEADROOM_HERE();
Python:
import pytau pytau.trackMemoryHeadroomHere()
10.100. TAU_SET_INTERRUPT_INTERVAL
Change the inter-interrupt interval for tracking memory and headroom
C/C++:
TAU_SET_INTERRUPT_INTERVAL
int valueFortran:
TAU_SET_INTERRUPT_INTERVAL
integer valueSet the interrupt interval for tracking memory and headroom (See TAU_TRACK_MEMORY and TAU_TRACK_MEMORY_HEADROOM ). By default an inter-interrupt interval of 10 seconds is used in TAU. This call allows the user to set it to a different value specified by the argument value.
C/C++ :
TAU_SET_INTERRUPT_INTERVAL(2) /* invokes the interrupt handler for memory every 2s */
Fortran :
call TAU_SET_INTERRUPT_INTERVAL(2)
Python:
import pytau pytau.setInterruptTnterval(2)
10.101. CT
Returns the type information for a variable
C/C++:
CT
<type> variableThe CT macro returns the runtime type information string of a variable. This is useful in constructing the type parameter of the TAU_PROFILE macro. For templates, the type information can be constructed using the type of the return and the type of each of the arguments (parameters) of the template. The example in the following macro will clarify this.
C/C++ :
TAU_PROFILE("foo::memberfunc()", CT(*this), TAU_DEFAULT);
10.102. TAU_TYPE_STRING
Creates a type string
C++:
TAU_TYPE_STRING
string &variable
string &type_stringThis macro assigns the string constructed in type_string to the variable. The + operator and the CT macro can be used to construct the type string of an object. This is useful in identifying templates uniquely, as shown below.
C++ :
template<class PLayout>
ostream& operator<<(ostream& out, const ParticleBase<PLayout>& P) {
TAU_TYPE_STRING(taustr, "ostream (ostream, " + CT(P) + " )");
TAU_PROFILE("operator<<()"taustr, TAU_PARTICLE | TAU_IO);
...
}
When PLayout is instantiated with " UniformCartesian<3U, double> ",this generates the unique template name:
operator<<() ostream const ParticleBase<UniformCartesian<3U, double> > )
The following example illustrates the usage of the CT macro to extract the name of the class associated with the given object using CT(*this);
template<class PLayout>
unsigned ParticleBase<PLayout7>::GetMessage(Message& msg, int node) {
TAU_TYPE_STRING(taustr, CT(*this) + "unsigned (Message, int)");
TAU_PROFILE("ParticleBase::GetMessage()", taustr, TAU_PARTICLE);
...
}
When PLayout is instantiated with " UniformCartesian<3U, double> ",this generates the unique template name:
ParticleBase::GetMessage() ParticleBase<UniformCartesian<3U, double> > unsigned (Message, int)
10.103. TAU_DB_DUMP
Dumps the profile database to disk
C/C++:
TAU_DB_DUMPFortran:
TAU_DB_DUMPDumps the profile database to disk. The format of the files is the same as regular profiles, they are simply prefixed with "dump" instead of "profile".
C/C++ :
TAU_DB_DUMP();
Fortran :
call TAU_DB_DUMP()
10.104. TAU_DB_MERGED_DUMP
Dumps the profile database to disk
C/C++:
TAU_DB_MERGED_DUMPFortran:
TAU_DB_MERGED_DUMPDumps the profile database to disk. The format of the files is the same as merged profiles: tauprofile.xml
C/C++ :
TAU_DB_MERGED_DUMP();
Fortran :
call TAU_DB_MERGED_DUMP()
10.105. TAU_DB_DUMP_INCR
Dumps profile database into timestamped profiles on disk
C/C++:
TAU_DB_DUMP_INCRThis is similar to the TAU_DB_DUMP macro but it produces dump files that have a timestamp in their names. This allows the user to record timestamped incremental dumps as the application executes.
C/C++ :
TAU_DB_DUMP_INCR();
Python:
import pytau
pytau.dbDumpIncr("prefix")
10.106. TAU_DB_DUMP_PREFIX
Dumps the profile database into profile files with a given prefix
C/C++:
TAU_DB_DUMP_PREFIX
char *prefixFortran:
TAU_DB_DUMP_PREFIX
character prefix(size)The TAU_DB_DUMP_PREFIX macro dumps all profile data to disk and records a checkpoint or a snapshot of the profile statistics at that instant. The dump files are named <prefix>.<node>.<context>.<thread>. If prefix is "profile", the files are named profile.0.0.0, etc. and may be read by paraprof/pprof tools as the application executes.
C/C++ :
TAU_DB_DUMP_PREFIX("prefix");
Fortran :
call TAU_DB_DUMP_PREFIX("prefix")
Python :
import pytau
pytau.dbDump("prefix")
10.107. TAU_DB_DUMP_PREFIX_TASK
Dumps the profile database into profile files with a given task
C/C++:
TAU_DB_DUMP_PREFIX_TASK
char *PREFIX_TASKFortran:
TAU_DB_DUMP_PREFIX_TASK
character prefix(size)
integer task(size)The TAU_DB_DUMP_PREFIX_TASK macro dumps all profile data to disk and records a checkpoint or a snapshot of the profile statistics on a particular task at that instant. The dump files are named <prefix>.<node>.<context>.<thread>. If prefix is "profile", the files are named profile.0.0.0, etc. and may be read by paraprof/pprof tools as the application executes.
C/C++ :
TAU_DB_DUMP_PREFIX_TASK("PREFIX", taskid);
Fortran :
call TAU_DB_DUMP_PREFIX_TASK("PREFIX", taskid)
Python :
import pytau
pytau.dbDump("PREFIX", taskid)
10.108. TAU_DB_PURGE
Purges the performance data.
C/C++:
TAU_DB_PURGEPurges the performance data collected so far.
C/C++ :
TAU_DB_PURGE();
10.109. TAU_DUMP_FUNC_NAMES
Dumps function names to disk
C/C++:
TAU_DUMP_FUNC_NAMESThis macro writes the names of active functions to a file named dump_functionnames_<node>.<context>.
C/C++ :
TAU_DUMP_FUNC_NAMES();
Python:
import pytau pytau.dumpFuncNames()
10.110. TAU_DUMP_FUNC_VALS
Dumps performance data for given functions to disk.
C/C++:
TAU_DUMP_FUNC_VALS
char **inFuncs
int numFuncsTAU_DUMP_FUNC_VALS writes the data associated with the routines listed in inFuncs to disk. The number of routines is specified by the user in numFuncs.
C/C++ :
10.111. TAU_DUMP_FUNC_VALS_INCR
Dumps function values with a timestamp
C/C++:
TAU_DUMP_FUNC_VALS_INCR
char **inFuncs
int numFuncsSimilar to TAU_DUMP_FUNC_VALS . This macro creates an incremental selective dump and dumps the results with a date stamp to the filename such as sel_dumpThu-Mar-28-16:30:48-2002.0.0.0. In this manner the previous TAU_DUMP_FUNC_VALS_INCR(…) are not overwritten (unless they occur within a second).
C/C++ :
const char **inFuncs; /* The first dimension is functions, and the second dimension is counters */ double **counterExclusiveValues; double **counterInclusiveValues; int *numOfCalls; int *numOfSubRoutines; const char **counterNames; int numOfCouns; TAU_GET_FUNC_VALS(inFuncs, 2, counterExclusiveValues, counterInclusiveValues, numOfCalls, numOfSubRoutines, counterNames, numOfCouns); TAU_DUMP_FUNC_VALS(inFuncs, 2);
Python:
import pytau
pytau.dumpFuncValsIncr("foo", "bar", "bar2")
10.112. TAU_PROFILE_STMT
Executes a statement only when TAU is used.
C/C++:
TAU_PROFILE_STMT
statement statementTAU_PROFILE_STMT executes a statement, or declares a variable that is used only during profiling or for execution of a statement that takes place only when the instrumentation is active. When instrumentation is inactive (i.e., when profiling and tracing are turned off as described in Chapter 2), all macros are defined as null.
C/C++ :
TAU_PROFILE_STMT(T obj;); // T is a template parameter) TAU_TYPE_STRING(str, "void () " + CT(obj) );
10.113. TAU_PROFILE_CALLSTACK
Generates a callstack trace at a given location.
C/C++:
TAU_PROFILE_CALLSTACKWhen TAU is configured with -PROFILECALLSTACK configuration option, and this call is invoked, a callpath trace is generated. A GUI for viewing this trace is included in TAU’s utils/csUI directory. This option is deprecated.
C/C++ :
TAU_PROFILE_CALLSTACK();
10.114. TAU_TRACE_RECVMSG
Traces a receive operation
C/C++:
TAU_TRACE_RECVMSG
int tag
int source
int lengthFortran:
TAU_TRACE_RECVMSG
integer tag
integer source
integer lengthTAU_TRACE_RECVMSG traces a receive operation where tag represents the type of the message received from the source process. NOTE: When TAU is configured to use MPI (-mpiinc=<dir> -mpilib=<dir>), the TAU_TRACE_RECVMSG and TAU_TRACE_SENDMSG macros are not required. The wrapper interposition library in ---- $(TAU_MPI_LIBS) uses these macros internally for logging messages. ---- uses these macros internally for logging messages.
C/C++ :
if (pid == 0) {
TAU_TRACE_SENDMSG(currCol, sender, ncols * sizeof(T));
MPI_Send(vctr2, ncols * sizeof(T), MPI_BYTE, sender,
currCol, MPI_COMM_WORLD);
} else {
MPI_Recv(&ans, sizeof(T), MPI_BYTE, MPI_ANY_SOURCE,
MPI_ANY_TAG,MPI_COMM_WORLD, &stat);
MPI_Get_count(&stat, MPI_BYTE, &recvcount);
TAU_TRACE_RECVMSG(stat.MPI_TAG, stat.MPI_SOURCE, recvcount);
}
Fortran :
call TAU_TRACE_RECVMSG(tag, source, length) call TAU_TRACE_SENDMSG(tag, destination, length)
10.115. TAU_TRACE_SENDMSG
Traces a receive operation
C/C++:
TAU_TRACE_SENDMSG
int tag
int source
int lengthFortran:
TAU_TRACE_SENDMSG
integer tag
integer source
integer lengthTAU_TRACE_SENDMSG traces an inter-process message communication when a tagged message is sent to a destination process. NOTE: When TAU is configured to use MPI (-mpiinc=<dir> -mpilib=<dir>), the TAU_TRACE_SENDMSG and TAU_TRACE_SENDMSG macros are not required. The wrapper interposition library in ---- $(TAU_MPI_LIBS) uses these macros internally for logging messages. ---- uses these macros internally for logging messages.
C/C++ :
if (pid == 0) {
TAU_TRACE_SENDMSG(currCol, sender, ncols * sizeof(T));
MPI_Send(vctr2, ncols * sizeof(T), MPI_BYTE, sender,
currCol, MPI_COMM_WORLD);
} else {
MPI_Recv(&ans, sizeof(T), MPI_BYTE, MPI_ANY_SOURCE,
MPI_ANY_TAG,MPI_COMM_WORLD, &stat);
MPI_Get_count(&stat, MPI_BYTE, &recvcount);
TAU_TRACE_RECVMSG(stat.MPI_TAG, stat.MPI_SOURCE, recvcount);
}
Fortran :
call TAU_TRACE_RECVMSG(tag, source, length) call TAU_TRACE_SENDMSG(tag, destination, length)
10.116. TAU_PROFILE_PARAM1L
Creates a snapshot of the current apllication profile
C/C++:
TAU_PROFILE_PARAM1L
long number
char* nameFortran:
TAU_PROFILE_PARAM1L
char* name
integer number
integer lengthTrack the a given numerial parameter to a function and records each value as a seperate event. number is the parameter to be tracked. name is the name of this event.
C/C++: ---- int f1(int x) { TAU_PROFILE("f1()", "", TAU_USER); TAU_PROFILE_PARAM1L((long) x, "x"); … ---- Fortran: ---- subroutine ITERATION(val) integer val integer profiler(2) / 0, 0 / save profiler call TAU_PROFILE_TIMER(profiler, 'INTERATION') call TAU_PROFILE_START(profiler) call TAU_PROFILE_PARAM1L('value', val, 4) …. call TAU_PROFILE_STOP(profiler) return end ----
10.117. TAU_PROFILE_SNAPSHOT
Creates a snapshot of the current apllication profile
C/C++:
TAU_PROFILE_SNAPSHOT
char* nameFortran:
TAU_PROFILE_SNAPSHOT
char* name
integer lengthTAU_PROFILE_SNAPSHOT writes a snapshot profile representing the program’s execution up to this point. These file are written the system as snapshot.[node].[context].[thread] format. They can be merged by appending one to another. Uploading a snapshot to a PerfDMF database or packing them into a PPK file will condense them to a single profile (the last one).
C/C++: ---- TAU_PROFILE_SNAPSHOT(name); ---- Fortran: ---- TAU_PROFILE_SNAPSHOT(name, length); ---- Python: ---- import pytau; pytau.snapshot("name") ----
10.118. TAU_PROFILE_SNAPSHOT_1L
Creates a snapshot of the current apllication profile
C/C++:
TAU_PROFILE_SNAPSHOT_1L
char* name
int numberFortran:
TAU_PROFILE_SNAPSHOT_1L
char* name
integer number
integer lengthCalls TAU_PROFILE_SNAPSHOT giving it the as a name the name with a number appended.
10.119. TAU_PROFILER_CREATE
Creates a profiler object referenced as a standard pointer
C/C++:
TAU_PROFILER_CREATE
Timer timer
char* or string& function_name
char* or string& type
taugroup_t groupTAU_PROFILER_CREATE creates a timer the that can be controlled by the Timer pointer object. The TAU_PROFILER_* API is intended for applications to easily layer their legacy timing measurements APIs on top of TAU, Unlike other TAU API calls (TAU_PROFILE_TIMER) that are statically expanded in the source code, these calls allocate TAU entities on the heap. So the pointer to the TAU timer may be used as a handle to access the TAU performance data.
C/C++:
void *ptr; TAU_PROFILER_CREATE(ptr, "foo","", TAU_USER); TAU_PROFILER_START(ptr); foo(2); TAU_PROFILER_STOP(ptr);
Python:
import pytau
ptr = pytau.profileTimer("foo")
pytau.start(ptr)
foo(2)
pytau.stop(ptr)
10.120. TAU_CREATE_TASK
Creates a task id.
C/C++:
TAU_CREATE_TASK
Integer taskidTAU_CREATE_TASK creates a task with id 'taskid' this task is an independent event stream for which Profiler objects can be started and stop on. TAU will increment the taskids as needed an write out profiles and traces from the task as if they were thread.
C/C++:
void *ptr; int taskid; TAU_PROFILER_CREATE(ptr, "foo","", TAU_USER); TAU_CREATE_TASK(taskid); TAU_PROFILER_START_TASK(ptr,taskid); foo(2); TAU_PROFILER_STOP_TASK(ptr,taskid);
10.121. TAU_PROFILER_START
starts a profiler object created by
C/C++:
TAU_PROFILER_START
Timer timerTAU_PROFILER_START starts a profiler timer by passing the pointer created by the TAU_PROFILER_CREATE .
C/C++:
void *ptr; TAU_PROFILER_CREATE(ptr, "foo","", TAU_USER); TAU_PROFILER_START(ptr); foo(2); TAU_PROFILER_STOP(ptr);
Python:
import pytau
ptr = pytau.profileTimer("foo")
pytau.start(ptr)
foo(2)
pytau.stop(ptr)
10.122. TAU_PROFILER_START_TASK
Starts a profiler object created by
C/C++:
TAU_PROFILER_START_TASK
Timer timerTAU_PROFILER_START_TASK starts a profiler timer on a task by passing the pointer created by the TAU_PROFILER_CREATE and a task created by TAU_CREATE_TASK on a given task.
C/C++:
void *ptr; int taskid; TAU_PROFILER_CREATE(ptr, "foo","", TAU_USER); TAU_CREATE_TASK(taskid); TAU_PROFILER_START_TASK(ptr,taskid); foo(2); TAU_PROFILER_STOP_TASK(ptr,taskid);
10.123. TAU_PROFILER_STOP
stops a profiler object created by
C/C++:
TAU_PROFILER_STOP
Timer timerTAU_PROFILER_STOP stops a profiler timer by passing the pointer created by the TAU_PROFILER_CREATE .
C/C++:
void *ptr; TAU_PROFILER_CREATE(ptr, "foo","", TAU_USER); TAU_PROFILER_START(ptr); foo(2); TAU_PROFILER_STOP(ptr);
Python:
import pytau
ptr = pytau.profileTimer("foo")
pytau.start(ptr)
foo(2)
pytau.stop(ptr)
10.124. TAU_PROFILER_STOP_TASK
Stops a profiler object on a task
C/C++:
TAU_PROFILER_STOP_TASK
Timer timerTAU_PROFILER_STOP_TASK STOPs a profiler timer on a task by passing the pointer created by the TAU_PROFILER_CREATE and a task created by TAU_CREATE_TASK .
C/C++:
void *ptr; int taskid; TAU_PROFILER_CREATE(ptr, "foo","", TAU_USER); TAU_CREATE_TASK(taskid); TAU_PROFILER_START_TASK(ptr,taskid); foo(2); TAU_PROFILER_STOP_TASK(ptr,taskid);
10.125. TAU_PROFILER_GET_CALLS
Gets the number of times this timer, created by
C/C++:
TAU_PROFILER_GET_CALLS
Timer timer
long& callsTAU_PROFILER_GET_CALLS returns the number of times this timer is started (ie. The number of times the section of code being profiled was executed).
C/C++:
void *ptr; TAU_PROFILER_CREATE(ptr, "foo","", TAU_USER); TAU_PROFILER_START(ptr); foo(2); long calls; TAU_PROFILER_GET_CALLS(ptr, &calls);
10.126. TAU_PROFILER_GET_CALLS_TASK
Gets the number of times this timer, created by
C/C++:
TAU_PROFILER_GET_CALLS_TASK
Timer timer
long& calls
int taskidTAU_PROFILER_GET_CALLS_TASK returns the number of times this timer is started (ie. The number of times the section of code being profiled was executed) on a given task.
C/C++:
void *ptr; int taskid; TAU_PROFILER_CREATE(ptr, "foo","", TAU_USER); TAU_CREATE_TASK(taskid); TAU_PROFILER_START_TASK(ptr, taskid); foo(2); long calls; TAU_PROFILER_GET_CALLS_TASK(ptr, &calls, taskid);
10.127. TAU_PROFILER_GET_CHILD_CALLS
Gets the number of calls made while this timer was running
C/C++:
TAU_PROFILER_GET_CHILD_CALLS
Timer timer
long& callsTAU_PROFILER_GET_CHILD_CALLS Gets the number of timers started while timer was running. This is non-recursive, only timers started directly count.
C/C++:
void *ptr; TAU_PROFILER_CREATE(ptr, "foo","", TAU_USER); TAU_PROFILER_START(ptr); foo(2); TAU_PROFILER_STOP(ptr); long calls; TAU_PROFILER_GET_CHILD_CALLS(ptr, &calls);
10.128. TAU_PROFILER_GET_CHILD_CALLS_TASK
Gets the number of child call for this timer, created by
C/C++:
TAU_PROFILER_GET_CHILD_CALLS_TASK
Timer timer
long& child_calls
int taskidTAU_PROFILER_GET_CHILD_CALLS_TASK returns the number of times this timer is started (ie. The number of times the section of code being profiled was executed).
C/C++:
void *ptr; int taskid; TAU_PROFILER_CREATE(ptr, "foo","", TAU_USER); TAU_CREATE_TASK(taskid); TAU_PROFILER_START_TASK(ptr, taskid); foo(2); long child_calls; TAU_PROFILER_GET_CHILD_CALLS_TASK(ptr, &child_calls, taskid);
10.129. TAU_PROFILER_GET_INCLUSIVE_VALUES
Returns the inclusive amount of a metric spend by this timer.
C/C++:
TAU_PROFILER_GET_INCLUSIVE_VALUES
Timer timer
double& inclTAU_PROFILER_GET_INCLUSIVE_VALUES Returns the inclusive amount of a metric spend while this timer was running (and any subsequent timers called from this timer.)
C/C++:
void *ptr; TAU_PROFILER_CREATE(ptr, "foo","", TAU_USER); TAU_PROFILER_START(ptr); foo(2); TAU_PROFILER_STOP(ptr); double incl[TAU_MAX_COUNTERS]; TAU_PROFILER_GET_INCLUSIVE_VALUES(ptr, &incl);
10.130. TAU_PROFILER_GET_INCLUSIVE_VALUES_TASK
Returns the inclusive amount of a metric spend by this timer on a given task.
C/C++:
TAU_PROFILER_GET_INCLUSIVE_VALUES_TASK
Timer timer
double& incl
int taskidTAU_PROFILER_GET_INCLUSIVE_VALUES_TASK Returns the inclusive amount of a metric spend while this timer was running (and any subsequent timers called from this timer) on a given task.
C/C++:
void *ptr; int taskid; TAU_PROFILER_CREATE(ptr, "foo","", TAU_USER); TAU_CREATE_TASK(taskid); TAU_PROFILER_START(ptr); foo(2); TAU_PROFILER_STOP(ptr); double incl[TAU_MAX_COUNTERS]; TAU_PROFILER_GET_INCLUSIVE_VALUES_TASK(ptr, &incl, taskid);
10.131. TAU_PROFILER_GET_EXCLUSIVE_VALUES
Returns the exclusive amount of a metric spend by this timer.
C/C++:
TAU_PROFILER_GET_EXCLUSIVE_VALUES
Timer timer
double& exclTAU_PROFILER_GET_EXCLUSIVE_VALUES Returns the exclusive amount of the metric spend while this timer was running (and while no other subsequent timers was running.)
C/C++:
void *ptr; TAU_PROFILER_CREATE(ptr, "foo","", TAU_USER); TAU_PROFILER_START(ptr); foo(2); TAU_PROFILER_STOP(ptr); double excl[TAU_MAX_COUNTERS]; TAU_PROFILER_GET_EXCLUSIVE_VALUES(ptr, &excl);
10.132. TAU_PROFILER_GET_EXCLUSIVE_VALUES_TASK
Returns the exclusive amount of a metric spend by this timer on a given task.
C/C++:
TAU_PROFILER_GET_EXCLUSIVE_VALUES_TASK
Timer timer
double& excl
int taskidTAU_PROFILER_GET_EXCLUSIVE_VALUES_TASK Returns the exclusive amount of the metric spend while this timer was running (and while no other subsequent timers was running) on a given task.
C/C++:
void *ptr; int taskid; TAU_PROFILER_CREATE(ptr, "foo","", TAU_USER); TAU_CREATE_TASK(taskid); TAU_PROFILER_START(ptr); foo(2); TAU_PROFILER_STOP(ptr); double excl[TAU_MAX_COUNTERS]; TAU_PROFILER_GET_EXCLUSIVE_VALUES_TASK(ptr, &excl, taskid);
10.133. TAU_PROFILER_GET_COUNTER_INFO
Returns information about all the timers created.
C/C++:
TAU_PROFILER_GET_COUNTER_INFO
const char * counters
int &num_countersTAU_PROFILER_GET_COUNTER_INFO Gets the number of counters created and an array of the counters containing information about the counters.
C/C++:
void *ptr;
TAU_PROFILER_CREATE(ptr, "foo","", TAU_USER);
TAU_PROFILER_START(ptr);
foo(2);
TAU_PROFILER_STOP(ptr);
const char **counters;
int numcounters;
TAU_PROFILER_GET_COUNTER_INFO(&counters, &numcounters);
printf("numcounters = %d\n", numcounters);
for (j = 0; j < numcounters ; j++)
{
printf(">>>");
printf("counter [%d] = %s\n", j, counters[j]);
}
10.134. TAU_PROFILER_GET_COUNTER_INFO_TASK
Returns information about all the timers created on a task.
C/C++:
TAU_PROFILER_GET_COUNTER_INFO_TASK
const char * counters
int &num_counters
int taskidTAU_PROFILER_GET_COUNTER_INFO_TASK Gets the number of counters created and an array of the counters containing information about the counters on a given task.
C/C++:
void *ptr;
int taskid;
TAU_PROFILER_CREATE(ptr, "foo","", TAU_USER);
TAU_CREATE_TASK(taskid);
TAU_PROFILER_START_TASK(ptr, taskid);
foo(2);
TAU_PROFILER_STOP_TASK(ptr, taskid);
const char **counters;
int numcounters;
TAU_PROFILER_GET_COUNTER_INFO_TASK(&counters, &numcounters, taskid);
printf("numcounters = %d\n", numcounters);
for (j = 0; j < numcounters ; j++)
{
printf(">>>");
printf("counter [%d] = %s\n", j, counters[j]);
}
10.135. TAU_QUERY_DECLARE_EVENT
Returns a event handle.
C/C++:
TAU_QUERY_DECLARE_EVENT
void * eventTAU_QUERY_DECLARE_EVENT Creates a event handle for querying TAU events.
C/C++:
char[100] str;
TAU_QUERY_DECLARE_EVENT(event);
TAU_QUERY_GET_CURRENT_EVENT(event);
TAU_QUERY_GET_EVENT_NAME(event, str);
printf("current event is: %d.\n", str);
10.136. TAU_QUERY_GET_CURRENT_EVENT
set event to be the current TAU event.
C/C++:
TAU_QUERY_GET_CURRENT_EVENT
void * eventTAU_QUERY_GET_CURRENT_EVENT Set event to be the current TAU event in the context in which this call is made.
C/C++:
char[100] str;
TAU_QUERY_DECLARE_EVENT(event);
TAU_QUERY_GET_CURRENT_EVENT(event);
TAU_QUERY_GET_EVENT_NAME(event, str);
printf("current event is: %d.\n", str);
10.137. TAU_QUERY_GET_EVENT_NAME
Gets the name of a given event.
C/C++:
TAU_QUERY_GET_EVENT_NAME
void * event
char * strTAU_QUERY_GET_EVENT_NAME Set str to be the event name to the given event name.
C/C++:
char[100] str;
TAU_QUERY_DECLARE_EVENT(event);
TAU_QUERY_GET_CURRENT_EVENT(event);
TAU_QUERY_GET_EVENT_NAME(event, str);
printf("current event is: %d.\n", str);
10.138. TAU_QUERY_GET_PARENT_EVENT
gets the parent of the current event.
C/C++:
TAU_QUERY_GET_PARENT_EVENT
void * eventTAU_QUERY_GET_PARENT_EVENT Set event to be the parent event to the current event.
C/C++:
char[100] str;
TAU_QUERY_DECLARE_EVENT(event);
TAU_QUERY_GET_PARENT_EVENT(event);
TAU_QUERY_GET_EVENT_NAME(event, str);
printf("parent event is: %d.\n", str);
11. TAU Mapping API
Introduction
TAU allows the user to map performance data of entities from one layer to another in multi-layered software. Mapping is used in profiling (and tracing) both synchronous and asynchronous models of computation.
For mapping, the following macros are used. First locate and identify the higher-level statement using the TAU_MAPPING macro. Then, associate a function identifier with it using the TAU_MAPPING_OBJECT . Associate the high level statement to a FunctionInfo object that will be visible to lower level code, using TAU_MAPPING_LINK , and then profile entire blocks using TAU_MAPPING_PROFILE . Independent sets of statements can be profiled using TAU_MAPPING_PROFILE_TIMER , TAU_MAPPING_PROFILE_START , and TAU_MAPPING_PROFILE_STOP macros using the FunctionInfo object.
The TAU examples/mapping directory has two examples (embedded and external) that illustrate the use of this mapping API for generating object-oriented profiles.
11.1. TAU_MAPPING
Encapsulates a C++ statement for profiling
C/C++:
TAU_MAPPING
statement statement
TauGroup_t keyTAU_MAPPING is used to encapsulate a C++ statement as a timer. A timer will be made, named by the statment, and will profile the statement. The key given can be used with TAU_MAPPING_LINK to retrieve the timer.
C/C++ :
int main(int argc, char **argv) {
Array <2> A(N, N), B(N, N), C(N,N), D(N, N);
// Original statement:
// A = B + C + D;
//Instrumented statement:
TAU_MAPPING(A = B + C + D; , TAU_USER);
...
}
11.2. TAU_MAPPING_CREATE
Creates a mapping
C/C++:
TAU_MAPPING_CREATE
char *name
char *type
char *groupname
unsigned long key
int tidTAU_MAPPING_CREATE creates a mapping and associates it with the key that is specified. Later, this key may be used to retrieve the FunctionInfo object associated with this key for timing purposes. The thread identifier is specified in the tid parameter.
C/C++ :
class MyClass {
public:
MyClass() {
TAU_MAPPING_LINK(runtimer, TAU_USER);
}
~MyClass() {}
void Run(void) {
TAU_MAPPING_PROFILE(runtimer); // For one object
TAU_PROFILE("MyClass::Run()", " void (void)", TAU_USER1);
cout <<"Sleeping for 2 secs..."<<endl;
sleep(2);
}
private:
TAU_MAPPING_OBJECT(runtimer) // EMBEDDED ASSOCIATION
};
int main(int argc, char **argv) {
TAU_PROFILE_INIT(argc, argv);
TAU_PROFILE("main()", "int (int, char **)", TAU_DEFAULT);
MyClass x, y, z;
TAU_MAPPING_CREATE("MyClass::Run() for object a", " " , TAU_USER,
"TAU_USER", 0);
MyClass a;
TAU_PROFILE_SET_NODE(0);
cout <<"Inside main"<<endl;
a.Run();
x.Run();
y.Run();
}
11.3. TAU_MAPPING_LINK
Creates a mapping link
C/C++:
TAU_MAPPING_LINK
FunctionInfo FuncIdVar
unsigned long KeyTAU_MAPPING_LINK creates a link between the object defined in TAU_MAPPING_OBJECT (that identifies a statement) and the actual higher-level statement that is mapped with TAU_MAPPING . The Key argument represents a profile group to which the statement belongs, as specified in the TAU_MAPPING macro argument. For the example of array statements, this link should be created in the constructor of the class that represents the expression. TAU_MAPPING_LINK should be executed before any measurement takes place. It assigns the identifier of the statement to the object to which FuncIdVar refers. For example
C/C++ :
class MyClass {
public:
MyClass() { }
~MyClass() { }
void Run(void) {
TAU_MAPPING_OBJECT(runtimer)
TAU_MAPPING_LINK(runtimer, (unsigned long) this);
TAU_MAPPING_PROFILE(runtimer); // For one object
TAU_PROFILE("MyClass::Run()", " void (void)", TAU_USER1);
/* ... */
}
};
int main(int argc, char **argv) {
TAU_PROFILE_INIT(argc, argv);
TAU_PROFILE("main()", "int (int, char **)", TAU_DEFAULT);
MyClass x, y, z;
MyClass a;
TAU_MAPPING_CREATE("MyClass::Run() for object a", " " ,
(TauGroup_t) &a, "TAU_USER", 0);
TAU_MAPPING_CREATE("MyClass::Run() for object x", " " ,
(TauGroup_t) &x, "TAU_USER", 0);
TAU_PROFILE_SET_NODE(0);
cout <<"Inside main"<<endl;
a.Run();
x.Run();
y.Run();
TAU_MAPPING_CREATE , TAU_MAPPING_OBJECT , TAU_MAPPING_PROFILE
11.4. TAU_MAPPING_OBJECT
Declares a mapping object
C/C++:
TAU_MAPPING_OBJECT
FunctionInfo FuncIdVarTo create storage for an identifier associated with a higher level statement that is mapped using TAU_MAPPING , we use the TAU_MAPPING_OBJECT macro. For example, in the TAU_MAPPING example, the array expressions are created into objects of a class ExpressionKernel, and each statement is an object that is an instance of this class. To embed the identity of the statement we store the mapping object in a data field in this class. This is shown below:
C/C++ :
template<class LHS,class Op,class RHS,class EvalTag>
class ExpressionKernel : public Pooma::Iterate_t {
public:
typedef ExpressionKernel<LHS,Op,RHS,EvalTag> This_t;
//
// Construct from an Expr.
// Build the kernel that will evaluate the expression on the
// given domain.
// Acquire locks on the data referred to by the expression.
//
ExpressionKernel(const LHS&,const Op&,const RHS&,
Pooma::Scheduler_t&);
virtual ~ExpressionKernel();
// Do the loop.
virtual void run();
private:
// The expression we will evaluate.
LHS lhs_m;
Op op_m;
RHS rhs_m;
TAU_MAPPING_OBJECT(TauMapFI)
};
11.5. TAU_MAPPING_PROFILE
Profiles a block based on a mapping
C/C++:
TAU_MAPPING_PROFILE
FunctionInfo *FuncIdVarThe TAU_MAPPING_PROFILE macro measures the time and attributes it to the statement mapped in TAU_MAPPING macro. It takes as its argument the identifier of the higher level statement that is stored using TAU_MAPPING_OBJECT and linked to the statement using TAU_MAPPING_LINK macros. TAU_MAPPING_PROFILE measures the time spent in the entire block in which it is invoked. For example, if the time spent in the run method of the class does work that must be associated with the higher-level array expression, then, we can instrument it as follows:
C/C++ :
// Evaluate the kernel
// Just tell an InlineEvaluator to do it.
template<class LHS,class Op,class RHS,class EvalTag>
void
ExpressionKernel<LHS,Op,RHS,EvalTag>::run() {
TAU_MAPPING_PROFILE(TauMapFI)
// Just evaluate the expression.
KernelEvaluator<EvalTag>().evalate(lhs_m,op_m,rhs_m);
// we could release the locks here or in dtor
}
11.6. TAU_MAPPING_PROFILE_START
Starts a mapping timer
C/C++:
TAU_MAPPING_PROFILE_START
Profiler timer
int tidTAU_MAPPING_PROFILE_START starts the timer that is created using TAU_MAPPING_PROFILE_TIMER . This will measure the elapsed time in groups of statements, instead of the entire block. A corresponding stop statement stops the timer as described next. The thread identifier is specified in the tid parameter.
C/C++ :
template<class LHS,class Op,class RHS,class EvalTag>
void
ExpressionKernel<LHS,Op,RHS,EvalTag>::run() {
TAU_MAPPING_PROFILE_TIMER(timer, TauMapFI);
printf("ExpressionKernel::run() this = 4854\n", this);
// Just evaluate the expression.
TAU_MAPPING_PROFILE_START(timer);
KernelEvaluator<EvalTag>().evaluate(lhs_m, op_m, rhs_m);
TAU_MAPPING_PROFILE_STOP();
// we could release the locks here instead of in the dtor.
}
11.7. TAU_MAPPING_PROFILE_STOP
Stops a mapping timer
C/C++:
TAU_MAPPING_PROFILE_STOP
Profiler timer
int tidTAU_MAPPING_PROFILE_STOP stops the timer that is created using TAU_MAPPING_PROFILE_TIMER . This will measure the elapsed time in groups of statements, instead of the entire block. A corresponding stop statement stops the timer as described next. The thread identifier is specified in the tid parameter.
C/C++ :
template<class LHS,class Op,class RHS,class EvalTag>
void
ExpressionKernel<LHS,Op,RHS,EvalTag>::run() {
TAU_MAPPING_PROFILE_TIMER(timer, TauMapFI);
printf("ExpressionKernel::run() this = 4854\n", this);
// Just evaluate the expression.
TAU_MAPPING_PROFILE_START(timer);
KernelEvaluator<EvalTag>().evaluate(lhs_m, op_m, rhs_m);
TAU_MAPPING_PROFILE_STOP();
// we could release the locks here instead of in the dtor.
}
11.8. TAU_MAPPING_PROFILE_TIMER
Declares a mapping timer
C/C++:
TAU_MAPPING_PROFILE_TIMER
Profiler timer
FunctionInfo *FuncIdVarTAU_MAPPING_PROFILE_TIMER enables timing of individual statements, instead of complete blocks. It will attribute the time to a higher-level statement. The second argument is the identifier of the statement that is obtained after TAU_MAPPING_OBJECT and TAU_MAPPING_LINK have executed. The timer argument in this macro is any variable that is used subsequently to start and stop the timer.
C/C++ :
template<class LHS,class Op,class RHS,class EvalTag>
void
ExpressionKernel<LHS,Op,RHS,EvalTag>::run() {
TAU_MAPPING_PROFILE_TIMER(timer, TauMapFI);
printf("ExpressionKernel::run() this = 4854\n", this);
// Just evaluate the expression.
TAU_MAPPING_PROFILE_START(timer);
KernelEvaluator<EvalTag>().evaluate(lhs_m, op_m, rhs_m);
TAU_MAPPING_PROFILE_STOP();
// we could release the locks here instead of in the dtor.
}
12. Runtime Environment Variables
| VARIABLE NAME | DESCRIPTION |
|---|---|
TAU_PROFILE |
Set to 1 to have TAU profile your code (on by default unless tracing is enabled) |
TAU_TRACE |
Set to 1 to have TAU trace your code |
PROFILEDIR |
Specifies the directory where profile files are to be stored (defaults to current directory). See Selective Profiling |
TRACEDIR |
Specifies the directory where trace file are to be stored (defaults to current directory). See Generating Event Traces |
TAU_CALLPATH |
When set to 1 TAU will generate call-path data. Use with TAU_CALLPATH_DEPTH. |
TAU_CALLPATH_DEPTH |
Sets the depth of the callpath profiling. Use with TAU_CALLPATH environment variable. |
TAU_PROFILE_FORMAT |
When set to |
TAU_TRACE_FORMAT |
Set to |
TAU_SUMMARY |
Set this variables to 1 to generate just min/max/stddev/mean statistics instead of per-node data. Use paraprof -dumpsummary and then pprof -f profile.Max/Min to see the data. |
TAU_CALLSITE |
When set to 1 TAU will provide call site information for events in profile and trace output. Configure TAU with -bfd=download and -useropt="-g" . |
TAU_TRACEFILE |
Specifies the name of Vampir trace file. Use with -TRACE TAU configuration option. See Generating Event Traces |
TAU_KEEP_TRACEFILES |
Retains the intermediate trace files when TAU_TRACEFILE is used to generate Vampir trace output. Use with -TRACE TAU configuration option. See Generating Event Traces |
| VARIABLE NAME | DESCRIPTION |
|---|---|
TAU_METRICS |
Colon delimited list of TAU/PAPI/LIQWID,etc metrics to profile |
TAU_TRACK_MEMORY_FOOTPRINT |
When set TAU will track resident set size (VmRSS) and peak memory usage (VmHWM) or the high water mark of resident set size, the same values provided by the 'top' command. |
TAU_TRACK_POWER |
Enables tracking of power consumption via periodic interrupt. |
TAU_COMPENSATE |
Attempt to compensate for profiling overhead in profiles. |
TAU_COMPENSATE_ITERATIONS |
Set the number of iterations TAU uses to estimate the measurement overhead. A larger number of iteration will increases profiling precision (default 1000). |
TAU_TRACK_SIGNALS |
Set this variables to 1 to capture callstack as metadata at point of failure. |
TAU_SYNCHRONIZE_CLOCKS |
When set TAU will correct for any time discrepancies between nodes because of their CPU clock lag. This should produce more reliable trace data. |
TAU_VERBOSE |
When set TAU will print out information about the its configuration when running a instrumented application. |
TAU_MUSE_PACKAGE |
Sets the MAGNET/MUSE package name. Use with the -muse TAU configuration option. See Using Hardware Counters for Measurement |
PAPI_EVENT |
Sets the hardware counter to use when TAU is configured with -PAPI. See Using Hardware Performance Counters |
PCL_EVENT |
Sets the hardware counter to use when TAU is configured with -PCL. See Using Hardware Performance Counters |
| VARIABLE NAME | DESCRIPTION |
|---|---|
TAU_SAMPLING |
Default value is 0 (off). When TAU_SAMPLING is set, we collect additional profile or trace information (depending on whether TAU_PROFILE or TAU_TRACE is set respectively) via periodic sampling at runtime. Metrics collected and sampling period is controlled by TAU_EBS_SOURCE and TAU_EBS_PERIOD variables respectively. The TAU_EBS_UNWIND variable determines if callstack unwinding is enabled at each sample. For TAU_PROFILE, in addition to regular TAU instrumented profile output, samples will show up as additional events prefixed by [SAMPLE] for each unique function, file and source line number combination. These events are grouped under [INTERMEDIATE] event nodes for the instrumented TAU context where the samples occured. In addition, if TAU_EBS_UNWIND is active, [UNWIND] event nodes may be generated for each discovered callstack entry found by the callstack unwinder. TAU_SAMPLING is dependent on the availability of BFD as determined by the -bfd configuration option when building TAU. Its ability to resolve sample addresses into function, file name and source line number information may be limited or missing if BFD is missing or is installed with limited functionality. If in doubt, please try building TAU with "-bfd=download". Any one of function, file name and source line number may be missing. In the event all three are, the event is marked as "UNRESOLVED". The TAU_EBS_KEEP_UNRESOLVED_ADDR variable enables addresses to be retained for unresolved results. |
TAU_EBS_SOURCE |
Default value is "itimer". This variable sets the metric that determines the period of sampling. If the value is "itimer" (default), it represents the number of microseconds between samples (as determined by TAU_EBS_PERIOD). If the value is a PAPI metric (eg. PAPI_FP_INS), then it represents the number of counts of that metric between samples (eg. every 10,000 floating-point instructions if PAPI_FP_INS is used). For "itimer", the samples occur as a result of system timer interrupts while for PAPI they occur in response to PAPI counter overflow interrupts set to the value of the TAU_EBS_PERIOD. |
TAU_EBS_PERIOD |
Default value is 1,000. This variable sets the period between samples. The semantics of this value is discussed in the section above on TAU_EBS_SOURCE. |
TAU_EBS_UNWIND |
Default value is 0 (off). This enables callstack unwinding for each sample using the callstack unwinder specified at TAU configuration time. As of this writing, only the libunwind tool is supported. Support for other callstack unwinders like StackwalkerAPI will be included. The TAU_EBS_UNWIND_DEPTH variable is used to control how many times the TAU sampling framework will be allowed to unwind the callstack. |
TAU_EBS_UNWIND_DEPTH |
Default value is 10. This controls how many layers of the callstack TAU should unwind before attaching the result to the appropriate TAU event context. |
TAU_EBS_KEEP_UNRESOLVED_ADDR |
Default value is 0 (off). When set, this variable allows sample addresses that fail to be resolved by BFD to be recorded as "UNRESOLVED <modulename> ADDR <addr> instead of "UNRESOLVED <modulename>". This provides nominally more information than the default scenario in light of missing BFD information. |
TAU_EBS_RESOLUTION |
Can be set to file, function or line. Is line by default. Event based sampling will resolve to the selected level of granularity. |
| VARIABLE NAME | DESCRIPTION |
|---|---|
TAU_THROTTLE |
Enables the runtime throttling of events that are lightweight. See Selective Profiling |
TAU_THROTTLE_NUMCALLS |
Set the maximum number of calls that will be profiled for any function when TAU_THROTTLE is enabled. See Selective Profiling |
TAU_THROTTLE_PERCALL |
Set the minimum inclusive time (in milliseconds) a function has to have to be instrumented when TAU_THROTTLE is enabled. See Selective Profiling |
TAU_SELECT_FILE |
When set to the location of a valid selective instrumentation file TAU will include/exclude the specified source at runtime. |
TAU_COMPILER_SELECT_FILE |
When set to the location of a valid selective instrumentation file the TAU LLVM plugin will include/exclude the specified source. |
TAU_COMPILER_MIN_INSTRUCTION_COUNT |
Excludes functions from instrumentation if their instruction count is below the set value, Defaults to 50. Set to 1 to include all functions. |
| VARIABLE NAME | DESCRIPTION |
|---|---|
TAU_TRACK_MPI_T_PVARS |
Set this variable to 1 to enable collection of MPI_T PVAR values |
TAU_MPI_T_CVAR_METRICS |
Set this to the MPI_T variable(s) you want to control, in conjunction with the values set in |
TAU_MPI_T_CVAR_VALUES |
Set this to the value(s) you want assigned to the variable(s) specified in |
TAU_SET_NODE |
Set this to 0 to allow MPI configurations of TAU to work correctly with serial codes. |
TAU_TRACK_MESSAGE |
Track MPI message statistics (profiling), messages lines (tracing). |
TAU_COMM_MATRIX |
Generate MPI communication matrix data. |
TAU_IBM_BG_HWP_COUNTERS |
Set this variable to 1 to include IBM’s UPC Hardware Performance counters in the metadata for process 0. Requires the use of MPI. |
| VARIABLE NAME | DESCRIPTION |
|---|---|
TAU_CUPTI_API |
Default: |
TAU_THREAD_PER_GPU_STREAM |
Set this to 1 to report each GPU stream as a distinct TAU thread. Currently supports CUPTI only. |
TAU_ROCM_PCS_CUS |
Set this to 1 to report each ROCm PC sample according to the device id and the computational unit that triggered the event. |
TAU_CUPTI_PC_HWB |
Set to the hardware buffer size (in MBytes) to use with cupti PC sampling (activated with the -cupti_pc option to tau_exec) |
TAU_CUPTI_PC_PERIOD |
Set to the sampling period to use with cupti PC sampling (activated with the -cupti_pc option to tau_exec) |
L0_METRICGROUP |
Specify Intel GPU Metrics. Check available metrics with unitrace |
TAU_L0_SAMPLING_INTERVAL |
Set to the sampling period to use with L0 PC Sampling (activated with the -l0_pc option to tau_exec and the unit is usecond) |
TAU_OMPT_DISABLE_OFFLOAD |
Set to disable OMPT callbacks for device-side offload events. |
TAU_CUPTI_PC_HWB |
Set to change the size (in MB) of the buffer for CUPTI PC sampling. |
TAU_CUPTI_PC_PERIOD |
Set to change the sampling perior(in cycles) for CUPTI PC sampling. |
TAU_USE_ROCSDK_SAMPLING_STOC |
Force TAU to configure ROCm PC sampling in stochastic mode (enables stall events). |
TAU_USE_ROCSDK_SAMPLING_HOST |
Force TAU to configure ROCm PC sampling in host-trap mode. |