TAU Instrumentation Options
Selective Instrumentation Options
Selective Instrumentation File Specification
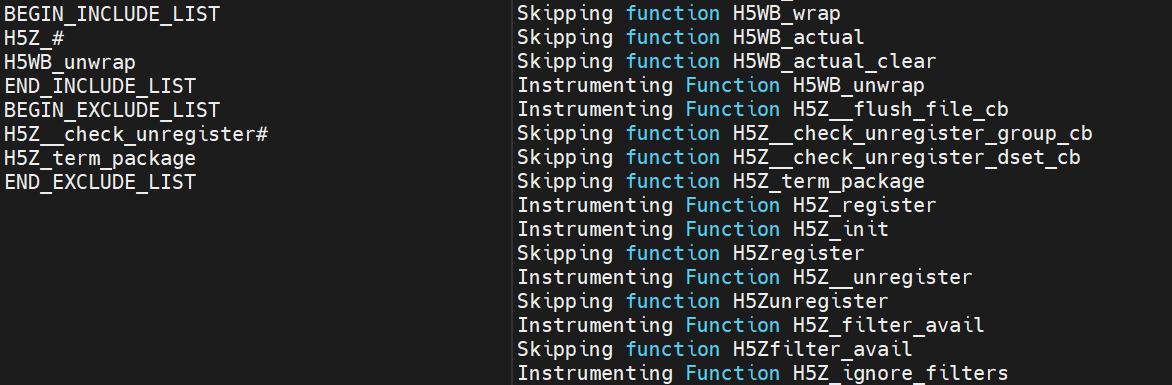
The selective instrumentation file has the following sections, each preceded and followed by:
BEGIN_EXCLUDE_LIST / END_EXCLUDE_LIST or BEGIN_INCLUDE_LIST / END_INCLUDE_LIST
|
exclude/include list of routines and/or files for instrumentation. The list of routines to be excluded from instrumentation is specified, one per line, enclosed by |
BEGIN_FILE_EXCLUDE_LIST / END_FILE_EXCLUDE_LIST or BEGIN_FILE_INCLUDE_LIST / END_FILE_INCLUDE_LIST
|
Similarly, files can be included or excluded with the |
BEGIN_INSTRUMENT_SECTION / END_INSTRUMENT_SECTION
|
Manually editing the selective instrumentation file gives you more options. These tags allow you to control the type of instrumentation performed in certain portions of your application. |
-
Static and Dynamic timers can be set by specifying either a range of line numbers or a routine.
static timer name="foo_bar" file="foo.c" line=17 to line=18
dynamic timer routine="int foo1(int)
-
Static and Dynamic phases can be set by specifying either a range of line numbers or a routine. If you do not configure TAU with
-PROFILEPHASEthese phases will be converted to regular timers.static phase routine="int foo(int) dynamic phase name="foo1_bar" file="foo.c" line=26 to line=27
-
Loops in the source code can be profiled by specifying a routine in which all loop should be profiled, like:
loops file="loop_test.cpp" routine="multiply"
-
With [memoryoptions] the following events are tracked: memory allocation, memory deallocation, and memory leaks.
memory file="foo.f90" routine="INIT"
-
IO Events track the size, in bytes of read, write, and print statements.
io file="foo.f90" routine="RINB"
Both Memory and IO events are represented along with their call-stack; the length of which can be set with environment variable TAU_CALLPATH_DEPTH .
Selective instrumention can be set at compile time by setting -tau_options=-optTauSelectFile=<file> in the TAU_OPTIONS environment variable when compiling with the TAU compiler wrapper scripts. Alternatively an application can be selectively instrumented at runtime by setting the TAU_SELECT_FILE environment variable to the selective instrumentation file’s location in the application’s execution environment.
|
Due to the limitations of the some compilers (IBM xlf, PGI pgf90, GNU gfortran), the size of the memory reported for a Fortran Array is not the number of bytes but rather the number of elements. |
Running an application using DynInstAPI
TAU also allows you to dynamically instrument your application using the DynInst package. There are a few limitation to DyInst: 1) only function level events will be captured and 2) your application must be compiled with debugging symbols ( -g ).
To install the DynInstAPI package, configure TAU with -dyinst= option which will point TAU to where dyninst is installed. Use the tau_run tool to instrument your application at runtime.
The command-line options accepted by tau_run are:
Usage: tau_run [-Xrun<Taulibrary> ][-v][-o outfile] \
       [-f <instrumentation file> ] <application> [args]
By default, libTAU . so is loaded by tau_run. However, the user can override this and specify another file using the -Xrun<Taulibrary>. In this case lib<Taulibrary>.so will be loaded using LD_LIBRARY_PATH .
To use tau_run , TAU is configured with DyninstAPI as shown below:
% configure -dyninst=/usr/local/packages/dyninstAPI
% make install
% cd tau/examples/dyninst
% make install
% tau_run klargest 2500 23
% pprof; paraprof
Rewriting Binaries
Using MAQAO
TAU also allows you to rewrite your application using the MAQAO package included in PDToolkit 3.17 or above( http://tau.uoregon.edu/pdt.tgz ).
Install PDToolkit 3.17+ and configure TAU with -pdt= option which will point TAU to where PDToolkit is installed. Use the tau_rewrite tool to instrument your application. (If TAU is not configured with PDT 3.17+, then tau_rewrite defaults to tau_run.)
% configure -pdt=/usr/local/packages/pdtoolkit-3.17
% make install
% tau_rewrite -T scorep,pdt  -loadlib=/tmp/libfoo.so ./a.out -o a.inst
Using PEBIL
TAU also allows you to rewrite your application using the PEBIL package included in PDToolkit 3.18.1 or above( http://tau.uoregon.edu/pdt.tgz ).
Install PDToolkit 3.18.1 and configure TAU with -pdt= option which will point TAU to where PDToolkit is installed. Use the tau_pebil_rewrite tool to instrument your application.
% tau_pebil_rewrite -T <commands> -f select.tau <exe> [-o] <output_exe>
The select.tau file supports outer-loop level instrumentation and exclude/include lists of functions just like tau_instrumentor’s select.tau (same format). Also, -T <options> are identical to tau_exec -T options.
Using DynInstAPI
TAU also allows you to rewrite your application using the DyninstAPI package.
To install the DynInstAPI, configure TAU with -dyninst= options which will point TAU to where dyninst is installed, you can also use -dyninst=download, and TAU will automatically download and install DynInstAPI and its dependencies.
When configuring TAU with DynInstAPI, it will show the environment variables you need to set, which are DYNINSTAPI_RT_LIB and LD_LIBRARY_PATH .
% ./configure -dyninst=download -bfd=download
% make install
% tau_run -T <commands> -f select.tau <exe> [-o] <output_exe>
The select.tau file supports exclude/include lists of functions just like tau_instrumentor’s select.tau (same format). Also, -T <options> are identical to tau_exec -T options.
In some cases, flags such as -O2 can prevent DynInstAPI from reading the binaries, if possible, applications or libraries should be compiled with the flags -g -fno-ipa-sra -fno-ipa-ra -fno-ipa-vrp -fno-omit-frame-pointer
Library Instrumentation with DynInstAPI
With DynInstAPI instrumentation can be inserted into libraries. The limitations are that the library should be included in an application using RUNPATH instead of RPATH.
To instrument libraries, tau_run is used with the flag -l . Also, the flag -v is useful if selective instrumentation is used.
LD_LIBRARY_PATH can be used instead of -loadlib, but the user must ensure that the correct library is used by the binary.
Profiling each call to a function
By default TAU profiles the total time (inclusive/exclusive) spent on a given function. Profiling each function call for an application that calls some function hundred of thousands of times, is impractical since the profile data would grow enormously. But configuring TAU with the -PROFILEPARAM option will have TAU profile select functions each time they are called. But TAU will also group some of these function calls together according to the value of the parameter they are given. For example if a function mpisend(int i) is called 2000 times 1000 times with 512 and 1000 times with 1024 then we will receive two profile for mpisend() one we it is called with 512 and one when it is called with 1024. This reduces the overhead since we are profiling mpisend() two times not 2000 times.
Profiling with Hardware counters
LIST OF COUNTERS:
Set the TAU_METRICS environment variable with a comma separated list of metrics or to use the old method set the following values for the COUNTER<1-25> environment variables.
-
GET_TIME_OF_DAY- For the default profiling option using gettimeofday() -
SGI_TIMERS- For-SGITIMERSconfiguration option under IRIX -
CRAY_TIMERS- For-CRAYTIMERSconfiguration option under Cray X1. -
LINUX_TIMERS- For -LINUXTIMERS configuration option under Linux -
CPU_TIME- For user+system time from getrusage() call with-CPUTIME -
P_WALL_CLOCK_TIME- For PAPI’s WALLCLOCK time using-PAPIWALLCLOCK -
P_VIRTUAL_TIME- For PAPI’s process virtual time using-PAPIVIRTUAL -
TAU_MUSE- For reading counts of Linux OS kernel level events when MAGNET/MUSE is installed and -muse configuration option is enabled. MUSE .TAU_MUSE_PACKAGEenvironment variable has to be set to package name (busy_time, count, etc.) -
TAU_MPI_MESSAGE_SIZE- For tracking the cumulative message size for all MPI operations by a node for each routine. -
ENERGY- For tracking the power use of the application in joules. Requires an -arch=craycnl configuration. -
ACCEL_ENERGY- For tracking the power use of the application on accelerators in joules. Requires an -arch=craycnl configuration.
|
When TAU is configured with -TRACE -MULTIPLECOUNTERS and -papi=<dir> options, the COUNTER1 environment variable must be set to GET_TIME_OF_DAY to allow TAU’s tracing module to use a globally synchronized real-time clock for time-stamping event records. When we use tracing with hardware performance counters, the counters specified in environment variables COUNTER[2-25] are accessed at routine transitions and logged in the trace file. Use tau2vtf tool to convert TAU traces to VTF3 traces that may be loaded in the Vampir trace visualization tool. |
and PAPI/PCL options that can be found in [papi_table] and [pcl_table] . Example:
-
PCL_FP_INSTR- For floating point operations using PCL (-pcl=<dir>) -
PAPI_FP_INS- For floating point operations using PAPI (-papi=<dir>) -
PAPI_NATIVE_<event>- For native papi events using PAPI (-papi=<dir>)
NOTE: When -MULTIPLECOUNTERS is used with -TRACE option, the tracing library uses the wall-clock time from the function specified in the COUNTER1 variable. This should typically point to wall-clock time routines (such as GET_TIME_OF_DAY or SGI_TIMERS or LINUX_TIMERS ).
Example:
% setenv COUNTER1   P_WALL_CLOCK_TIME
% setenv COUNTER2 PAPI_L1_DCM
% setenv COUNTER3 PAPI_FP_INS
will produce profile files in directories called MULT_P_WALL_CLOCK_TIME, MULTI__PAPI_L1_DCM, and MULTI_PAPI_FP_INS.
| TAU_METRICS | EVENT Measured |
|---|---|
PAPI_L1_DCM |
Level 1 data cache misses |
PAPI_L1_ICM |
Level 1 instruction cache misses |
PAPI_L2_DCM |
Level 2 data cache misses |
PAPI_L2_ICM |
Level 2 instruction cache misses |
PAPI_L3_DCM |
Level 3 data cache misses |
PAPI_L3_ICM |
Level 3 instruction cache misses |
PAPI_L1_TCM |
Level 1 total cache misses |
PAPI_L2_TCM |
Level 2 total cache misses |
PAPI_L3_TCM |
Level 3 total cache misses |
PAPI_CA_SNP |
Snoops |
PAPI_CA_SHR |
Request for access to shared cache line (SMP) |
PAPI_CA_CLN |
Request for access to clean cache line (SMP) |
PAPI_CA_INV |
Cache Line Invalidation (SMP) |
PAPI_CA_ITV |
Cache Line Intervention (SMP) |
PAPI_L3_LDM |
Level 3 load misses |
PAPI_L3_STM |
Level 3 store misses |
PAPI_BRU_IDL |
Cycles branch units are idle |
PAPI_FXU_IDL |
Cycles integer units are idle |
PAPI_FPU_IDL |
Cycles floating point units are idle |
PAPI_LSU_IDL |
Cycles load/store units are idle |
PAPI_TLB_DM |
Data translation lookaside buffer misses |
PAPI_TLB_IM |
Instruction translation lookaside buffer misses |
PAPI_TLB_TL |
Total translation lookaside buffer misses |
PAPI_L1_LDM |
Level 1 load misses |
PAPI_L1_STM |
Level 1 store misses |
PAPI_L2_LDM |
Level 2 load misses |
PAPI_L2_STM |
Level 2 store misses |
PAPI_BTAC_M |
BTAC miss |
PAPI_PRF_DM |
Prefetch data instruction caused a miss |
PAPI_L3_DCH |
Level 3 Data Cache Hit |
PAPI_TLB_SD |
Translation lookaside buffer shootdowns (SMP) |
PAPI_CSR_FAL |
Failed store conditional instructions |
PAPI_CSR_SUC |
Successful store conditional instructions |
PAPI_CSR_TOT |
Total store conditional instructions |
PAPI_MEM_SCY |
Cycles Stalled Waiting for Memory Access |
PAPI_MEM_RCY |
Cycles Stalled Waiting for Memory Read |
PAPI_MEM_WCY |
Cycles Stalled Waiting for Memory Write |
PAPI_STL_ICY |
Cycles with No Instruction Issue |
PAPI_FUL_ICY |
Cycles with Maximum Instruction Issue |
PAPI_STL_CCY |
Cycles with No Instruction Completion |
PAPI_FUL_CCY |
Cycles with Maximum Instruction Completion |
PAPI_HW_INT |
Hardware interrupts |
PAPI_BR_UCN |
Unconditional branch instructions executed |
PAPI_BR_CN |
Conditional branch instructions executed |
PAPI_BR_TKN |
Conditional branch instructions taken |
PAPI_BR_NTK |
Conditional branch instructions not taken |
PAPI_BR_MSP |
Conditional branch instructions mispredicted |
PAPI_BR_PRC |
Conditional branch instructions correctly predicted |
PAPI_FMA_INS |
FMA instructions completed |
PAPI_TOT_IIS |
Total instructions issued |
PAPI_TOT_INS |
Total instructions executed |
PAPI_INT_INS |
Integer instructions executed |
PAPI_FP_INS |
Floating point instructions executed |
PAPI_LD_INS |
Load instructions executed |
PAPI_SR_INS |
Store instructions executed |
PAPI_BR_INS |
Total branch instructions executed |
PAPI_VEC_INS |
Vector/SIMD instructions executed |
PAPI_FLOPS |
Floating Point Instructions executed per second |
PAPI_RES_STL |
Cycles processor is stalled on resource |
PAPI_FP_STAL |
FP units are stalled |
PAPI_TOT_CYC |
Total cycles |
PAPI_IPS |
Instructions executed per second |
PAPI_LST_INS |
Total load/store instructions executed |
PAPI_SYC_INS |
Synchronization instructions executed |
PAPI_L1_DCH |
L1 D Cache Hit |
PAPI_L2_DCH |
L2 D Cache Hit |
PAPI_L1_DCA |
L1 D Cache Access |
PAPI_L2_DCA |
L2 D Cache Access |
PAPI_L3_DCA |
L3 D Cache Access |
PAPI_L1_DCR |
L1 D Cache Read |
PAPI_L2_DCR |
L2 D Cache Read |
PAPI_L3_DCR |
L3 D Cache Read |
PAPI_L1_DCW |
L1 D Cache Write |
PAPI_L2_DCW |
L2 D Cache Write |
PAPI_L3_DCW |
L3 D Cache Write |
PAPI_L1_ICH |
L1 instruction cache hits |
PAPI_L2_ICH |
L2 instruction cache hits |
PAPI_L3_ICH |
L3 instruction cache hits |
PAPI_L1_ICA |
L1 instruction cache accesses |
PAPI_L2_ICA |
L2 instruction cache accesses |
PAPI_L3_ICA |
L3 instruction cache accesses |
PAPI_L1_ICR |
L1 instruction cache reads |
PAPI_L2_ICR |
L2 instruction cache reads |
PAPI_L3_ICR |
L3 instruction cache reads |
PAPI_L1_ICW |
L1 instruction cache writes |
PAPI_L2_ICW |
L2 instruction cache writes |
PAPI_L3_ICW |
L3 instruction cache writes |
PAPI_L1_TCH |
L1 total cache hits |
PAPI_L2_TCH |
L2 total cache hits |
PAPI_L3_TCH |
L3 total cache hits |
PAPI_L1_TCA |
L1 total cache accesses |
PAPI_L2_TCA |
L2 total cache accesses |
PAPI_L3_TCA |
L3 total cache accesses |
PAPI_L1_TCR |
L1 total cache reads |
PAPI_L2_TCR |
L2 total cache reads |
PAPI_L3_TCR |
L3 total cache reads |
PAPI_L1_TCW |
L1 total cache writes |
PAPI_L2_TCW |
L2 total cache writes |
PAPI_L3_TCW |
L3 total cache writes |
PAPI_FML_INS |
FM ins |
PAPI_FAD_INS |
FA ins |
PAPI_FDV_INS |
FD ins |
PAPI_FSQ_INS |
FSq ins |
PAPI_FNV_INS |
Finv ins |
For example to measure the floating point operations in routines using PCL ,
% ./configure -pcl=/usr/local/packages/pcl-1.2
% setenv PCL_EVENT PCL_FP_INSTR
% mpirun -np 8 application
| PCL_EVENT | EVENT Measured |
|---|---|
PCL_L1CACHE_READ |
L1 (Level one) cache reads |
PCL_L1CACHE_WRITE |
L1 cache writes |
PCL_L1CACHE_READWRITE |
L1 cache reads and writes |
PCL_L1CACHE_HIT |
L1 cache hits |
PCL_L1CACHE_MISS |
L1 cache misses |
PCL_L1DCACHE_READ |
L1 data cache reads |
PCL_L1DCACHE_WRITE |
L1 data cache writes |
PCL_L1DCACHE_READWRITE |
L1 data cache reads and writes |
PCL_L1DCACHE_HIT |
L1 data cache hits |
PCL_L1DCACHE_MISS |
L1 data cache misses |
PCL_L1ICACHE_READ |
L1 instruction cache reads |
PCL_L1ICACHE_WRITE |
L1 instruction cache writes |
PCL_L1ICACHE_READWRITE |
L1 instruction cache reads and writes |
PCL_L1ICACHE_HIT |
L1 instruction cache hits |
PCL_L1ICACHE_MISS |
L1 instruction cache misses |
PCL_L2CACHE_READ |
L2 (Level two) cache reads |
PCL_L2CACHE_WRITE |
L2 cache writes |
PCL_L2CACHE_READWRITE |
L2 cache reads and writes |
PCL_L2CACHE_HIT |
L2 cache hits |
PCL_L2CACHE_MISS |
L2 cache misses |
PCL_L2DCACHE_READ |
L2 data cache reads |
PCL_L2DCACHE_WRITE |
L2 data cache writes |
PCL_L2DCACHE_READWRITE |
L2 data cache reads and writes |
PCL_L2DCACHE_HIT |
L2 data cache hits |
PCL_L2DCACHE_MISS |
L2 data cache misses |
PCL_L2ICACHE_READ |
L2 instruction cache reads |
PCL_L2ICACHE_WRITE |
L2 instruction cache writes |
PCL_L2ICACHE_READWRITE |
L2 instruction cache reads and writes |
PCL_L2ICACHE_HIT |
L2 instruction cache hits |
PCL_L2ICACHE_MISS |
L2 instruction cache misses |
PCL_TLB_HIT |
TLB (Translation Lookaside Buffer) hits |
PCL_TLB_MISS |
TLB misses |
PCL_ITLB_HIT |
Instruction TLB hits |
PCL_ITLB_MISS |
Instruction TLB misses |
PCL_DTLB_HIT |
Data TLB hits |
PCL_DTLB_MISS |
Data TLB misses |
PCL_CYCLES |
Cycles |
PCL_ELAPSED_CYCLES |
Cycles elapsed |
PCL_INTEGER_INSTR |
Integer instructions executed |
PCL_FP_INSTR |
Floating point (FP) instructions executed |
PCL_LOAD_INSTR |
Load instructions executed |
PCL_STORE_INSTR |
Store instructions executed |
PCL_LOADSTORE_INSTR |
Loads and stores executed |
PCL_INSTR |
Instructions executed |
PCL_JUMP_SUCCESS |
Successful jumps executed |
PCL_JUMP_UNSUCCESS |
Unsuccessful jumps executed |
PCL_JUMP |
Jumps executed |
PCL_ATOMIC_SUCCESS |
Successful atomic instructions executed |
PCL_ATOMIC_UNSUCCESS |
Unsuccessful atomic instructions executed |
PCL_ATOMIC |
Atomic instructions executed |
PCL_STALL_INTEGER |
Integer stalls |
PCL_STALL_FP |
Floating point stalls |
PCL_STALL_JUMP |
Jump stalls |
PCL_STALL_LOAD |
Load stalls |
PCL_STALL_STORE |
Store Stalls |
PCL_STALL |
Stalls |
PCL_MFLOPS |
Millions of floating point operations/second |
PCL_IPC |
Instructions executed per cycle |
PCL_L1DCACHE_MISSRATE |
Level 1 data cache miss rate |
PCL_L2DCACHE_MISSRATE |
Level 2 data cache miss rate |
PCL_MEM_FP_RATIO |
Ratio of memory accesses to FP operations |
Using Hardware Performance Counters
While running the application, set the environment variable PCL_EVENT or TAU_METRICS , to specify which hardware performance counter TAU should use while profiling the application.
|
By default, only one counter is tracked at a time. To track more than one counter use |
To select floating point instructions for profiling using PAPI , you would:
% configure -papi=/usr/local/packages/papi-3.5.0
% make clean install
% cd examples/papi
% setenv TAU_METRICS PAPI_FP_INS
% a.out
In addition to the following events, you can use native events (see papi_native ) on a given CPU by setting TAU_ to PAPI_NATIVE_<event> . For example:
% setenv PAPI_NATIVE PAPI_NATIVE_PM_BIQ_IDU_FULL_CYC
% a.out
By default PAPI will profile events in all domains (users space, kernel, hypervisor, etc). You can restrict the set of domains for papi event profiling by using the TAU_PAPI_DOMAIN environment variable with these values (in a colon separated list, if desired): PAPI_DOM_USER, PAPI_DOM_KERNEL, PAPI_DOM_SUPERVISOR, and PAPI_DOM_OTHER like thus:
% setenv TAU_PAPI_DOMAIN PAPI_DOM_SUPERVISOR:PAPI_DOM_OTHER
Profiling with PerfLib
This profiling option is currently under development at LANL.
To configure TAU with PerfLib use the following arguments:
%> configure -perflib=[path_to_perflib lib directory]
             -perfinc=[path_to_perflib inc directory]
             -perflibrary=[argument send to the linker if different than default]

    After TAU is built a new Makefile will be generated with *-perflib-* in its
    name, use this Makefile when profiling applications with perflib.
After TAU is built a new Makefile will be generated with -perflib- in its name, use this Makefile when profiling applications with perflib.
After configuration and installation, toggle these three environment variables before running the application:
%> export PERF_PROFILE=1
%> export PERF_PROFILE_MPI=1
%> export PERF_PROFILE_MEMORY=1
%> export PERF_PROFILE_COUNTERS=1
%> export PERF_DATA_DIRECTORY=<directory>
We also provide a perf2tau conversion utilities to convert the remaining perflib profiles to regular TAU profiles. To use perf2tau set the environment variable perf_data_directory to the type of the profiling to be converted (the directory where the data is store will be called something like perf_data.[type]/). Or you may execute perf2tau with the type as an argument:
%> perf2tau [type]
See also the man page for perf2tau, [perf2tau] .
Running a Python application with TAU
TAU can automatically instrument all Python routines when the tau python package is imported. Add <TAUROOT>/<ARCH>/lib/bindings-<options> to the PYTHONPATH environment variable in order to use the TAU module.
To execute the program, tau.run routine is invoked with the name of the top level Python code. For e.g.,
#!/usr/bin/env python

import tau
from time import sleep

def f2():
    print "Inside f2: sleeping for 2 secs..."
    sleep(2)
def f1():
    print "Inside f1, calling f2..."
    f2()

def OurMain():
    f1()

tau.run('OurMain()')
instruments routines OurMain(), f1() and f2() although there are no instrumentation calls in the routines. To use this feature, TAU must be configured with the -pythoninc=<dir> option (and -pythonlib=<dir> if running under IBM). Before running the application, the environment variable PYTHONPATH and LD_LIBRARY_PATH should be set to include the TAU library directory (where tau.py is stored). Manual instrumentation of Python sources is also possible using the Python API and the pytau package. For e.g.,
#!/usr/bin/env python

import pytau
from time import sleep

x = pytau.profileTimer("A Sleep for excl 5 secs")
y = pytau.profileTimer("B Sleep for excl 2 secs")
pytau.start(x)
print "Sleeping for 5 secs ..."
sleep(5)
pytau.start(y)
print "Sleeping for 2 secs ..."
sleep(2)
pytau.stop(y)
pytau.dbDump()
pytau.stop(x)
shows how two timers x and y are created and used. Note, multiple timers can be nested, but not overlapping. Overlapping timers are detected by TAU at runtime and flagged with a warning (as exclusive time is not defined when timers overlap).
Running a Julia application with TAU
Julia applications are profiled using tau_julia , which is a wrapper around julia that makes the TAUProfile module available automatically. TAU provides the TAUProfile.jl package with three instrumentation approaches: manual timers, macro-based instrumentation, and automatic whole-program instrumentation.
To use Julia support, configure TAU with the -julia and -ittnotify flags. The -ittnotify flag enables TAU to resolve symbols in JIT-compiled Julia code when using event-based sampling.
% ./configure -bfd=download -dwarf=download -julia -ittnotify
% make clean install
For MPI or CUDA support, combine flags as needed:
% ./configure -bfd=download -dwarf=download -julia -ittnotify \
    -mpi -c++=mpicxx -cc=mpicc -fortran=mpif90
% ./configure -bfd=download -dwarf=download -julia -ittnotify \
    -cuda=/path/to/cuda
|
Do not use |
To run a Julia script with TAU profiling, use tau_julia . A -- separator separates tau_julia flags from Julia arguments:
% tau_julia -T serial,julia,ittnotify -- script.jl
% pprof
tau_julia accepts the same flags as tau_exec . Use -T to select a TAU configuration:
% tau_julia -T julia,ittnotify,mpi -- mpi_script.jl
% tau_julia -T julia,ittnotify,cupti -cupti -- cuda_script.jl
% tau_julia -T julia,ittnotify -ittnotify -ebs -- script.jl
When using event-based sampling (-ebs), pass -ittnotify as a tau_julia flag so that sampled addresses in JIT-compiled Julia code can be resolved to function names.
Manual Timers
The simplest form of instrumentation uses tau_start and tau_stop to bracket regions of code. The TAUProfile module is automatically available when using tau_julia .
using TAUProfile

function manual_timing_example()
    tau_start("manual_timing_example")
    println("Hello world!")
    sleep(0.5)
    result = sum(rand(1000, 1000))
    tau_stop("manual_timing_example")
    return result
end

manual_timing_example()
Every tau_start must have a matching tau_stop . Mismatched calls produce incorrect profiles. If the timed region can throw an exception, use the @tau macro instead.
Macro Instrumentation
The @tau macro wraps an expression with TAU timing. The timer is automatically stopped when the expression completes, including when an exception is thrown. @tau blocks can be nested.
using TAUProfile

result = @tau "outer_timer" begin
    sleep(0.2)

    result1 = @tau "inner_computation_1" begin
        sleep(0.1)
        sum(rand(100, 100))
    end

    result2 = @tau "inner_computation_2" begin
        sleep(0.1)
        sum(rand(200, 200))
    end

    result1 + result2
end
The @tau_func macro wraps an entire function definition with TAU timing. The timer name is derived from the function name automatically. It works with both standard and short-form function definitions.
@tau_func function matrix_multiply(A, B)
    return A * B
end

@tau_func quick_sum(arr) = sum(arr)
Automatic Instrumentation with @tau_rewrite
The @tau_rewrite macro provides whole-program automatic instrumentation. It compiles the target function and all its callees with TAU entry/exit hooks inserted automatically.
using TAUProfile

function fibonacci(n)
    if n <= 1
        return n
    end
    return fibonacci(n - 1) + fibonacci(n - 2)
end

function recursive_example()
    result = fibonacci(10)
    return result
end

my_sum(arr) = sum(arr)

function rewrite_example()
    println(recursive_example())
    arr = collect(1:100)
    s = my_sum(arr)
    println(s)
end

@tau_rewrite rewrite_example()
In this example, rewrite_example , recursive_example , fibonacci , and my_sum are all automatically instrumented, along with any library functions they call. After the call completes, the original uninstrumented method sources are restored.
Selective Instrumentation for @tau_rewrite
By default, @tau_rewrite instruments the entire call graph, which can produce very large profiles. Several functions are available to control which functions are instrumented. These must be called before @tau_rewrite .
Excluding and Including Modules
tau_rewrite_exclude_module excludes all functions defined in a module from instrumentation. By default, submodules are also excluded. Pass exact=true to exclude only the exact module. Accepts Module objects, Symbols, or Strings. Multiple modules can be passed in a single call.
tau_rewrite_exclude_module(Base)
tau_rewrite_exclude_module(:Base, :GPUArrays, :GPUCompiler)
tau_rewrite_exclude_module(Base; exact=true)
tau_rewrite_include_module_only provides a whitelist. When the whitelist is non-empty, only functions in whitelisted modules are instrumented.
tau_rewrite_include_module_only(MyModule)
tau_rewrite_include_module_only(ModA, ModB)
Excluding Functions
tau_rewrite_exclude_function excludes specific functions by function object, Symbol, or String. tau_rewrite_exclude_prefix excludes all functions whose name starts with a given prefix.
tau_rewrite_exclude_function(my_helper)
tau_rewrite_exclude_function(:my_helper)
tau_rewrite_exclude_prefix("_internal_")
Depth Limits
tau_rewrite_set_recursion_limit controls how deep into the call graph instrumentation reaches. A global limit controls the maximum depth from the root function. Per-module limits control depth within a specific module’s call chain and reset when crossing module boundaries. Setting n=0 means unlimited (the default).
tau_rewrite_set_recursion_limit(4)
tau_rewrite_set_recursion_limit(Base, 2)
@tau_rewrite main()
Multithreaded Julia
TAU supports profiling multithreaded Julia programs. Start Julia with multiple threads and enable deferred context tracing to ensure spawned tasks are instrumented:
% JULIA_NUM_THREADS=8 tau_julia -T julia,ittnotify,pthread -- script.jl
using Base.Threads
using TAUProfile
function worker(id::Int, n::Int)
total = zero(Float64)
for i in 1:n
total += sin(Float64(i) * 0.001)
end
return total
end
function main()
tasks = [@spawn(worker(i, 1_000_000)) for i in 1:100]
results = fetch.(tasks)
println("Sum: $(sum(results))")
end
tau_rewrite_exclude_module(Base)
tau_rewrite_deferred_contexts(true)
@tau_rewrite main()
Complete Example
This example demonstrates a typical workflow combining @tau_rewrite with depth limits to control profile size:
using Printf: @printf
using TAUProfile

function profile_test(n)
    @printf "Running loop of size %d\n" n
    for i = 1:n
        A = randn(100, 100, 20)
        m = maximum(A)
        Am = mapslices(sum, A; dims=2)
        B = A[:, :, 5]
        Bsort = mapslices(sort, B; dims=1)
        b = rand(100)
        C = B .* b
    end
end

function main()
    profile_test(1)
    profile_test(10)
    profile_test(100)
end

tau_rewrite_set_recursion_limit(4)
tau_rewrite_set_recursion_limit(Base, 2)
@tau_rewrite main()
% tau_julia -T serial,julia,ittnotify -- script.jl
% pprof
TAUProfile.jl API Summary
| Function | Description |
|---|---|
|
Start a named TAU timer. |
|
Stop a named TAU timer. |
|
Time an expression with automatic start/stop and exception safety. |
|
Wrap a function definition with automatic timing. |
|
Automatically instrument |
|
Functional form of |
|
Compile with instrumentation and return a callable wrapper. |
|
Exclude a function from automatic instrumentation. |
|
Exclude functions matching a name prefix. |
|
Exclude a module (and optionally its submodules). |
|
Whitelist a module; only whitelisted modules are instrumented. |
|
Set global call depth limit. |
|
Set per-module call depth limit. |
|
Skip trivial functions below a complexity threshold. |
|
Enable/disable instrumentation of |
|
Include/exclude argument types in timer labels. |
|
Reset all instrumentation options to defaults. |
pprof
pprof sorts and displays profile data generated by TAU. To view the profile, merely execute pprof in the directory where profile files are located (or set the PROFILEDIR environment variable).
% pprof
Its usage is explained below:
usage: pprof [-c|-b|-m|-t|-e|-i] [-r] [-s] [-n num] [-f filename] \
       [-l] [node numbers]
  -c : Sort by number of Calls
  -b : Sort by number of suBroutines called by a function
  -m : Sort by Milliseconds (exclusive time total)
  -t : Sort by Total milliseconds (inclusive time total) (DEFAULT)
  -e : Sort by Exclusive time per call (msec/call)
  -i : Sort by Inclusive time per call (total msec/call)
  -v : Sort by standard deViation (excl usec)
  -r : Reverse sorting order
  -s : print only Summary profile information
  -n num : print only first num functions
  -f filename : specify full path and Filename without node ids
  -p : suPpress conversion to hh:mm:ss:mmm format
  -l : List all functions and exit
  -d : Dump output format (for Racy) [node numbers] : prints only info about
	all contexts/threads of given node numbers
 node numbers : prints information about all contexts/threads
 for specified nodes
Running a JAVA application with TAU
Java applications are profiled/traced using tau_java as shown below:
% cd tau/examples/java/pi
% setenv LD_LIBRARY_PATH $LD_LIBRARY_PATH:<tauroot>/<arch>/lib
% tau_java  Pi
More information about tau_java can be found in the Tools section of the Reference Guide.
Running the application generates profile files with names having the form profile.<node>.<context>.<thread>. These files can be analyzed using pprof or paraprof.
Using a tau.conf File
If a tau.conf file is created, then code that uses that TAU lib will effected by the settings in tau.conf. For example, if a directory tau-2.21/tau_system_defaults is created and a tau.conf file is placed in it, TAU will read that file before doing the measurements. A user of that TAU libs can choose to override the contents of that file by placing a tau.conf in their own directory. But by default, if the sysadmin chooses to create this dir, all the users of the TAU libs will be globally affected by this tau.conf.
For example, tau.conf could be:
% cat tau.conf
TAU_LOG_PATH=/soft/apps/tau/logs
PROFILEDIR=$TAU_LOG_DIR
TAU_PROFILE_FORMAT=merged
TAU_SUMMARY=1
TAU_IBM_BG_HWP_COUNTERS=1
TAU_TRACK_MESSAGE=1
Then anyone using TAU from that directory will get TAU_IBM_BG_HWP_COUNTERS=1, TAU_TRACK_MESSAGE=1, etc.
Using Score-P with TAU
TAU can be configured to use the Score-P measurement infrastructure (www.score-p.org). To use Score-P, configure TAU with -scorep= option to point TAU to the Score-P installation. (Please use Score-P version 1.0 beta or above.) You may then instrument and run your application with TAU in a manor of your choosing.
Set the environment variable SCOREP_PROFILING_FORMAT to TAU_SNAPSHOT to produce TAU Snapshot files, which will be found in scorep*/tau/. Also, the Score-P library must be found in LD_LIBRARY_PATH.
Using UPC with TAU
Please see examples/upc for more details.
To instrument Berkeley UPC with GASP, configure TAU with -upcnetwork=<option> /where option is "mpi" or "udp". Then use a selective instrumentation file like the one shown below.
BEGIN_INSTRUMENT_SECTION
forall routine="#"
loops routine="#"
barrier routine="#"
fence routine="#"
notify routine="#"
END_INSTRUMENT_SECTION
Then tau_upc.sh can be used to build the application. If "udp" is used with -upcnetwork, then upcrun can be used to run the application. For "mpi", mpirun or a similar mechanism can be used.
To instrument UPC with Cray CCE compilers, the following will produce a configuration that supports Cray UPC and may be used with tau_upc.sh
module load PrgEnv-cray
./configure -arch=craycnl -pdt=<dir> -pdt_c++=g++
TAU can also build the DMAPP wrapper using Cray CCE compilers. When the -optDMAPP option is used when building the application with TAU using TAU_OPTIONS, DMAPP events are automatically instrumented with tau_upc.sh.