Analyzing Parallel Applications
Text summary
For a quick view summary of TAU performance, use pprof It reads and prints a summary of the TAU data in the current directory. For performance data with multiple metrics, move into one of the directories to get information about that metric:
%> cd MULTI__P_WALL_CLOCK_TIME
%> pprof
Reading Profile files in profile.*

NODE 0;CONTEXT 0;THREAD 0:
---------------------------------------------------------------------------------------
%Time    Exclusive    Inclusive       #Call      #Subrs  Inclusive Name
              msec   total msec                          usec/call
---------------------------------------------------------------------------------------
100.0           24          590           1           1     590963 main
 95.9           26          566           1           2     566911 multiply
 47.3          279          279           1           0     279280 multiply-opt
 44.1          260          260           1           0     260860 multiply-regular
ParaProf
To launch ParaProf, execute paraprof from the command line where the profiles are located. Launching ParaProf will bring up the manager window and a window displaying the profile data as shown below.
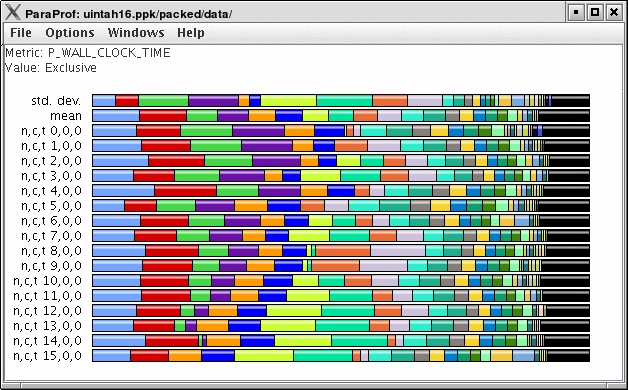
Figure 1. Main Data Window
For more information see the [paraprofdoc] .
Jumpshot
To use Argonne’s Jumpshot (bundled with TAU), first merge and convert TAU traces to slog2 format:
% tau_treemerge.pl
% tau2slog2 tau.trc tau.edf -o tau.slog2
% jumpshot tau.slog2

Launching Jumpshot will bring up the main display window showing the entire trace, zoom in
to see more detail.
Launching Jumpshot will bring up the main display window showing the entire trace, zoom in to see more detail.
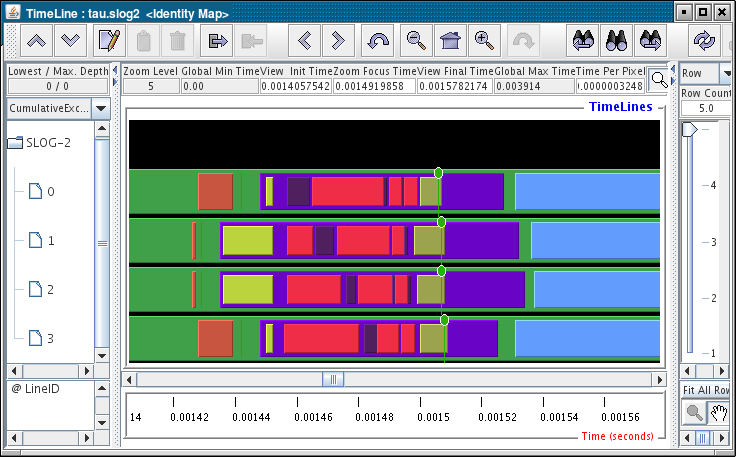
Figure 2. Main Data Window