Cluster Analysis
Cluster analysis is a valuable tool for reducing large parallel profiles down to representative groups for investigation. Currently, there are two types of clustering analysis implemented in PerfExplorer. Both hierarchical and k-means analysis are used to group parallel profiles into common clusters, and then the clusters are summarized. Initially, we used similarity measures computed on a single parallel profile as input to the clustering algorithms, although other forms of input are possible. Here, the performance data is organized into multi-dimensional vectors for analysis. Each vector represents one parallel thread (or process) of execution in the profile. Each dimension in the vector represents an event that was profiled in the application. Events can be any sub-region of code, including libraries, functions, loops, basic blocks or even individual lines of code. In simple clustering examples, each vector represents only one metric of measurement. For our purposes, some dissimilarity value, such as Euclidean or Manhattan distance, is computed on the vectors. As discussed later, we have tested hierarchical and $k$-means cluster analysis in PerfExplorer on profiles with over 32K threads of execution with few difficulties.
Dimension Reduction
Often, many hundreds of events are instrumented when profile data is collected. Clustering works best with dimensions less than 10, so dimension reduction is often necessary to get meaningful results. Currently, there is only one type of dimension reduction available in PerfExplorer. To reduce dimensions, the user specifies a minimum exclusive percentage for an event to be considered "significant".
To reduce dimensions, select the "Select Dimension Reduction" item under the "Analysis" main menu bar item. The following dialog will appear:
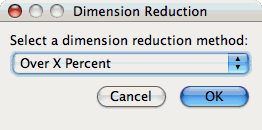
Select "Over X Percent". The following dialog will appear:
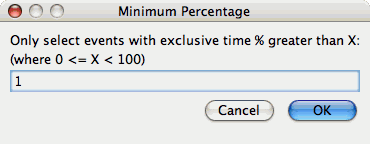
Enter a value, for example "1".
Max Number of Clusters
By default, PerfExplorer will attempt k-means clustering with values of k from 2 to 10. To change the maximum number of clusters, select the "Set Maximum Number of Clusters" item under the "Analysis" main menu item. The following dialog will appear:

Performing Cluster Analysis
To perform cluster analysis, you first need to select a metric. To select a metric, navigate through the tree of applications, experiments and trials, and expand the trial of interest, showing the available metrics, as shown in the figure below:
	Metric to Cluster
image::clusteringselection.png[Selecting a
	Metric to Cluster,width="6in",align="center"]
After selecting the metric of interest, select the "Do Clustering" item under the "Analysis" main menu bar item. The following dialog will appear:
	Clustering Options
image::confirmclustering.png[Confirm
	Clustering Options,width="2in",align="center"]
After confirming the clustering, the clustering will begin. When the clustering results are available, you can view them in the "Cluster Results" tab.
	Results
image::clusterresults.png[Cluster
	Results,width="6in",align="center"]
There are a number of images in the "Cluster Results" window. From left to right, the windows indicate the cluster membership histogram, a PCA scatterplot showing the cluster memberships, a virtual topology of the parallel machine, the minimum values for each event in each cluster, the average values for each event in each cluster, and the maximum values for each event in each cluster. Clicking on a thumbnail image in the main window will bring up the images, as shown below:
	Membership Histogram
image::histogram.png[Cluster
	Membership Histogram,width="4in",align="center"]
	Membership Scatterplot
image::scatterplot.png[Cluster
	Membership Scatterplot,width="4in",align="center"]
	Virtual Topology
image::topology.png[Cluster
	Virtual Topology,width="4in",align="center"]
	Average Behavior
image::averages.png[Cluster
	Average Behavior,width="4in",align="center"]