Preferences
Preferences are modified from the ParaProf Preferences Window, launched from the File menu. Preferences are saved between sessions in the .ParaProf/ParaProf.prefs
Preferences Window
In addition to displaying the text statistics for User Defined Events, ParaProf can also graph a particular User Event across all threads.

The preferences window allows the user to modify the behavior and display style of ParaProf’s windows. The font size affects bar height, a sample display is shown in the upper-right.
The Window defaults section will determine the initial settings for new windows. You may change the initial units selection and whether you want values displayed as percentages or as raw values.
The Settings section controls the following
-
Show Path Title in Reverse - Path title will normally be shown in normal order (/home/amorris/data/etc). They can be reverse using this option (etc/data/amorris/home). This only affects loaded trials and the titlebars of new windows.
-
Reverse Call Paths - This option will immediately change the display of all callpath functions between
Root ⇒ LeafandLeaf ⇐ Root. -
Statistics Computation - Turning this option on causes the mean computation to take the sum of value for a function across all threads and divide it by the total number of threads. With this option off the sum will only be divided by the number of threads that actively participated in the sum. This way the user can control whether or not threads which do not call a particular function are consider as a
0in the computation of statistics. -
Generate Reverse Calltree Data - This option will enable the generation of reverse callpath data necessary for the reverse callpath option of the statistics tree-table window.
-
Show Source Locations - This option will enable the display of source code locations in event names.
Default Colors
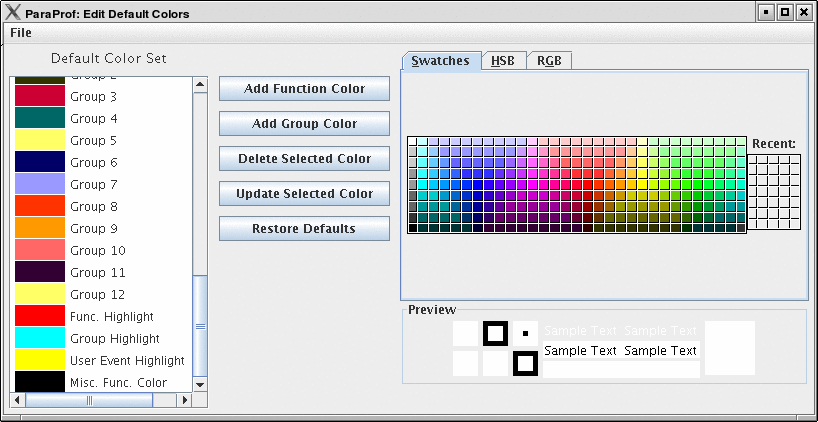
The default color editor changes how colors are distributed to functions whose color has not been specifically assigned. It is accessible from the File menu of the Preferences Window.
Color Map
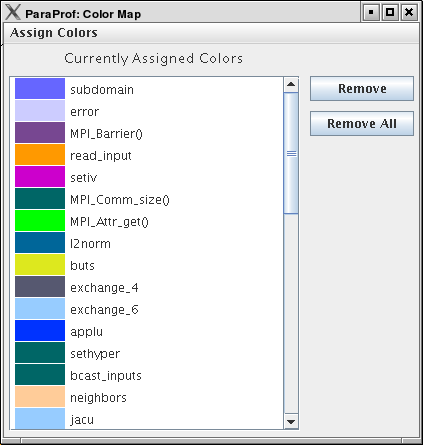
The color map shows specifically assigned colors. These values are used across all trials loaded so that the user can identify a particular function across multiple trials. In order to map an entire trial’s function set, Select "Assign Defaults from →" and select a loaded trial.
Individual functions can be assigned a particular color by clicking on them in any of the other ParaProf Windows.