Some Common Application Scenarios
Q. What routines account for the most time? How much?
-
Create a flat profile with wallclock time.

Figure 1. Flat Profile
Here is how to generate a flat profile with MPI
% setenv TAU_MAKEFILE /opt/apps/tau/tau2/x86_64/lib/Makefile.tau-mpi-pdt-pgi

% set path=(/opt/apps/tau/tau2/x86_64/bin $path)
% make F90=tau_f90.sh
(Or edit Makefile and change F90=tau_f90.sh)
% qsub  run.job
% paraprof -–pack app.ppk
	Move the app.ppk file to your desktop.

% paraprof app.ppk
Q. What loops account for the most time? How much?
-
Create a flat profile with wallclock time with loop instrumentation.

Figure 2. Flat Profile with Loops
Here is how to instrument loops in an application
% setenv TAU_MAKEFILE /opt/apps/tau/tau2/x86_64/lib/Makefile.tau-mpi-pdt
% setenv TAU_OPTIONS ‘-optTauSelectFile=select.tau –optVerbose’
% cat select.tau
  BEGIN_INSTRUMENT_SECTION
  loops routine=“#”
  END_INSTRUMENT_SECTION

% set path=(/opt/apps/tau/tau2/x86_64/bin $path)
% make F90=tau_f90.sh
(Or edit Makefile and change F90=tau_f90.sh)
% qsub  run.job
% paraprof -–pack app.ppk
	Move the app.ppk file to your desktop.

% paraprof app.ppk
Q. What MFlops am I getting in all loops?
-
Create a flat profile with PAPI_FP_INS/OPS and time with loop instrumentation.
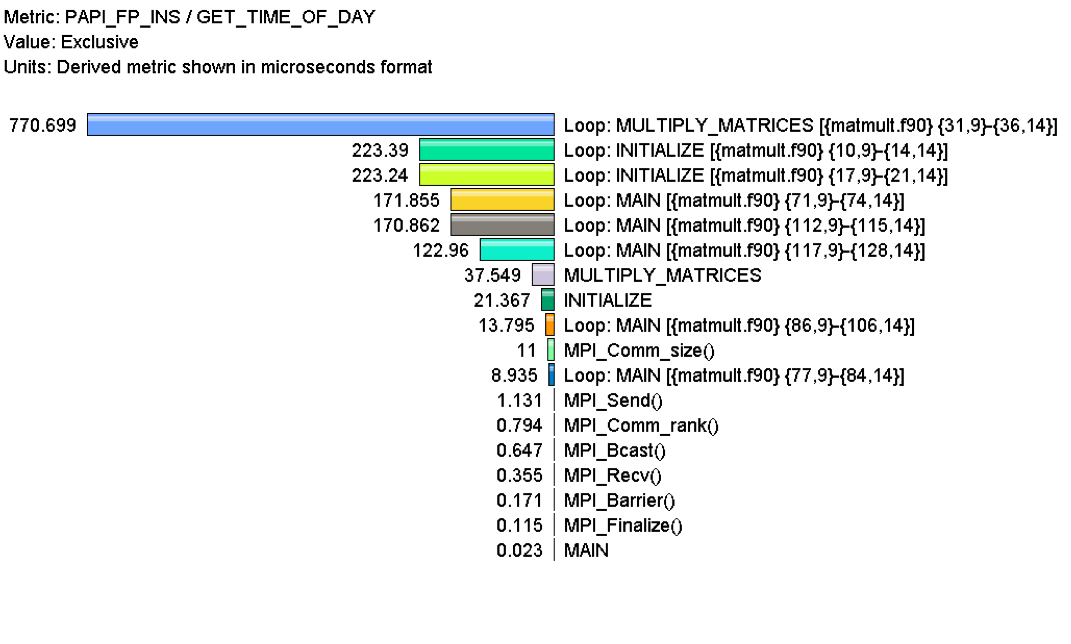
Figure 3. MFlops per loop
Here is how to generate a flat profile with FP operations
% setenv TAU_MAKEFILE /opt/apps/tau/tau2/x86_64/lib/Makefile.tau-papi-mpi-pdt-pgi
% setenv TAU_OPTIONS ‘-optTauSelectFile=select.tau –optVerbose’
% cat select.tau
  BEGIN_INSTRUMENT_SECTION
  loops routine=“#”
  END_INSTRUMENT_SECTION

% set path=(/opt/apps/tau/tau2/x86_64/bin $path)
% make F90=tau_f90.sh
(Or edit Makefile and change F90=tau_f90.sh)
% setenv TAU_METRICS GET_TIME_OF_DAY\:PAPI_FP_INS
% qsub  run.job
% paraprof -–pack app.ppk
	Move the app.ppk file to your desktop.
% paraprof app.ppk
  Choose 'Options' -> 'Show Derived Panel' -> Arg 1 = PAPI_FP_INS, Arg 2 =
	GET_TIME_OF_DAY, Operation = Divide -> Apply, close.
Q. Who calls MPI_Barrier() Where?
-
Create a callpath profile with given depth.

Figure 4. Callpath Profile
Here is how to generate a callpath profile with MPI
% setenv TAU_MAKEFILE
% /opt/apps/tau/tau2/x86_64/lib/Makefile.tau-mpi-pdt
% set path=(/opt/apps/tau/tau2/x86_64/bin $path)
% make F90=tau_f90.sh
(Or edit Makefile and change F90=tau_f90.sh)
% setenv TAU_CALLPATH 1
% setenv TAU_CALLPATH_DEPTH 100

% qsub  run.job
% paraprof -–pack app.ppk
	Move the app.ppk file to your desktop.
% paraprof app.ppk
(Windows -> Thread -> Call Graph)
Q. How do I instrument Python Code?
-
Create an python wrapper library.
Here to instrument python code
% setenv TAU_MAKEFILE /opt/apps/tau/tau2/x86_64/lib/Makefile.tau-icpc-python-mpi-pdt
% set path=(/opt/apps/tau/tau2/x86_64/bin $path)
% setenv TAU_OPTIONS ‘-optShared -optVerbose'
(Python needs shared object based TAU library)
% make F90=tau_f90.sh CXX=tau_cxx.sh CC=tau_cc.sh  (build pyMPI w/TAU)
% cat wrapper.py
  import tau
  def OurMain():
      import App
  tau.run(‘OurMain()’)
Uninstrumented:
% mpirun.lsf /pyMPI-2.4b4/bin/pyMPI ./App.py
Instrumented:
% setenv PYTHONPATH<taudir>/x86_64/<lib>/bindings-python-mpi-pdt-pgi
(same options string as TAU_MAKEFILE)
setenv LD_LIBRARY_PATH <taudir>/x86_64/lib/bindings-icpc-python-mpi-pdt-pgi\:$LD_LIBRARY_PATH
% mpirun –np 4 <dir>/pyMPI-2.4b4-TAU/bin/pyMPI ./wrapper.py
(Instrumented pyMPI with wrapper.py)
Q. What happens in my code at a given time?
-
Create an event trace.
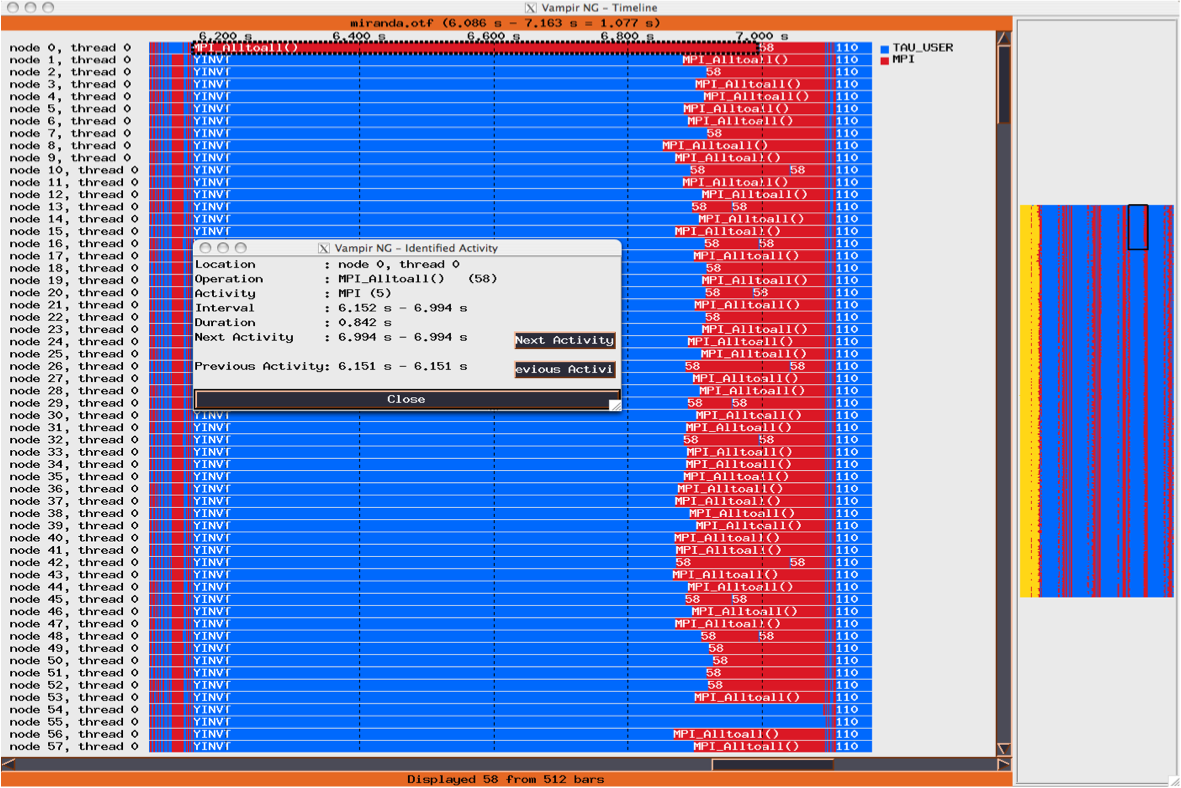
Figure 5. Tracing with Vampir
How to create a trace
% setenv TAU_MAKEFILE
% /opt/apps/tau/tau2/x86_64/lib/Makefile.tau-mpi-pdt-pgi
% set path=(/opt/apps/tau/tau2/x86_64/bin $path)
% make F90=tau_f90.sh
(Or edit Makefile and change F90=tau_f90.sh)
% setenv TAU_TRACE 1
% qsub  run.job
% tau_treemerge.pl
(merges binary traces to create tau.trc and tau.edf files)
JUMPSHOT:
% tau2slog2 tau.trc tau.edf –o app.slog2
% jumpshot app.slog2
   OR
VAMPIR:
% tau2otf tau.trc tau.edf app.otf –n 4 –z
(4 streams, compressed output trace)
% vampir app.otf
(or vng client with vngd server).
Q. How does my application scale?
-
Examine profiles in PerfExplorer.

Figure 6. Scalability chart
How to examine a series of profiles in PerfExplorer
% setenv TAU_MAKEFILE /opt/apps/tau/tau2/x86_64/lib/Makefile.tau-mpi-pdt
% set path=(/opt/apps/tau/tau2/x86_64/bin $path)
% make F90=tau_f90.sh
(Or edit Makefile and change F90=tau_f90.sh)
% qsub  run1p.job
% paraprof -–pack 1p.ppk
% qsub run2p.job
% paraprof -–pack 2p.ppk ...and so on.
On your client:
% taudb_configure --create-default
(taudb_configure run without any arguments will prompt for advanced options)
% perfexplorer_configure
(Yes to load schema, defaults)
% paraprof
(load each trial: Right click on trial ->Upload trial to DB
% perfexplorer
(Charts -> Speedup)