Eclipse PTP / CDT plug-in System
Installation
Be certain that the PTP / CDT / Photran plug-ins are installed and running properly in your eclipse installation. Use TAU’s perfdmf_configure utility to set up a performance database for Eclipse to store profile output.
Run the install_plug-ins.sh script located in [tau installation]/tools/src/eclipse with the location of your eclipse installation. e.g: ~/tau2/tools/src/eclipse/install_plug-ins.sh /opt/eclipse
Restart eclipse with the -clean flag after installing the plugins.
|
By default Eclipse will detect the presence of TAU on your system and configure itself appropriately so long as the TAU bin directory is in your path. Only if this fails will you need to setup the TAU preferences manually. |
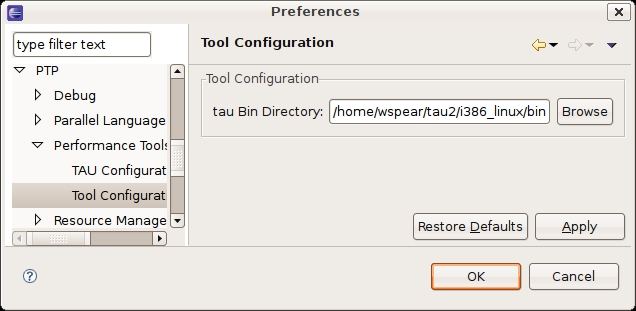
In eclipse go to the Window menu, select Preferences and go to the Performance Tools preferences section and the Tool Configuration subsection. If the PTP is available the Performance Tools section will be under the PTP menu. Enter the location of the desired TAU bin directory in your in the tau Bin Directory field.
Creating a TAU Launch Configuration
To create a TAU launch configuration, click the profile button added near the run and debug buttons. This will provide an interface for launching either a standard or parallel C, C++ or Fortran application, similar to the interface provided by the standard run configuration dialog. You may select a pre-existing run configuration or create a new one in the usual way.
The run configuration options are equivalent to those of a standard run configuration, with the addition of a performance analysis tab a parametric study tab and a TAU tab. To run an application with TAU first make sure that the TAU option is selected in the drop down box on the performance analysis tab. You may also specify that a TAU instrumented executable should not be run after it is built. This option will leave a new TAU specific build configuration available for your use. It will have the name of the original build configuration, with the TAU configuration options used appended. The executables available in such build configurations can be run through the standard run and debug launch configurations. This option can be useful if you need to launch TAU instrumented binaries outside of eclipse. There is also an option to select existing performance data. This will upload data specified on the filesystem to a selected database, rather than generating the data from a project in Eclipse.
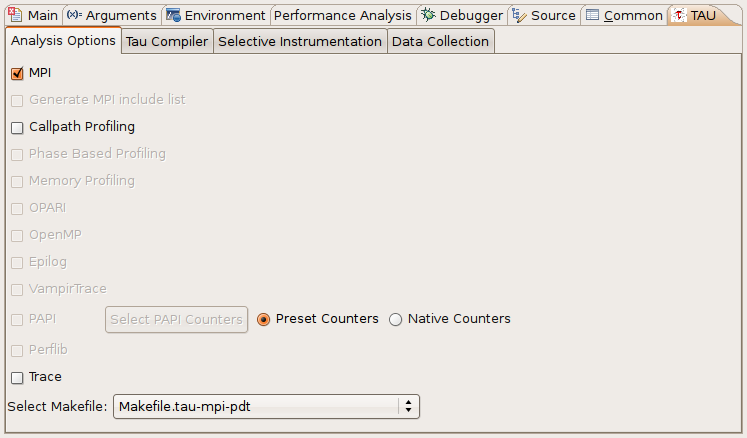
On the TAU tab you must select a TAU makefile from the available makefiles in the TAU architecture directory you specified. You may select specific configuration options to narrow the list of makefiles in the dropdown box. Only makefiles configured with the -pdt option will be listed. Additional TAU compiler options are provided on the TAU Compiler sub-tab.
If you select a makefile with the PAPI counter library and -MULTIPLECOUNTERS enabled you may specify the PAPI environment variables using the Select PAPI Counters button. The counters you select will be placed in the environment variables list for your run configuration.
You may specify the use of TAU selective instrumentation either by selecting a pre-defined selective instrumentation file, by selecting the internal option to have TAU to use a file generated by the selective instrumentation commands available in the Eclipse workspace or by selecting the automatic option to have eclipse generate a selective instrumentation file using TAU’s tau_reduce utility. Note that the automatic option will cause your project to be rebuilt and run twice.
By default TAU profile data will only be stored in a perfdmf database, if available. The database may be selected on the Data Collection sub-tab. You may specify that performance data should be kept on the file-system with the Keep Profiles option.
If you wish to collect the resulting profile data on TAU’s online Portal , check the "Upload profile data to TAU Portal" box. After the profiling has finished you will be prompted to provide your user name, password and specify the destination workspace. To view the profile data log on to the portal and select the specified workspace.
Selective Instrumentation
C, C and Fortran programs have several selective instrumentation options in Eclipse. The selective instrumentation sub-menu of the right click menu provided by C/C and Fortran projects, source files and routines in the C/C++ and program outline views allows inclusion, exclusion and loop level instrumentation to be specified for each of these objects. You may also clear instrumentation specified for each of these levels from the selective instrumentation menu.
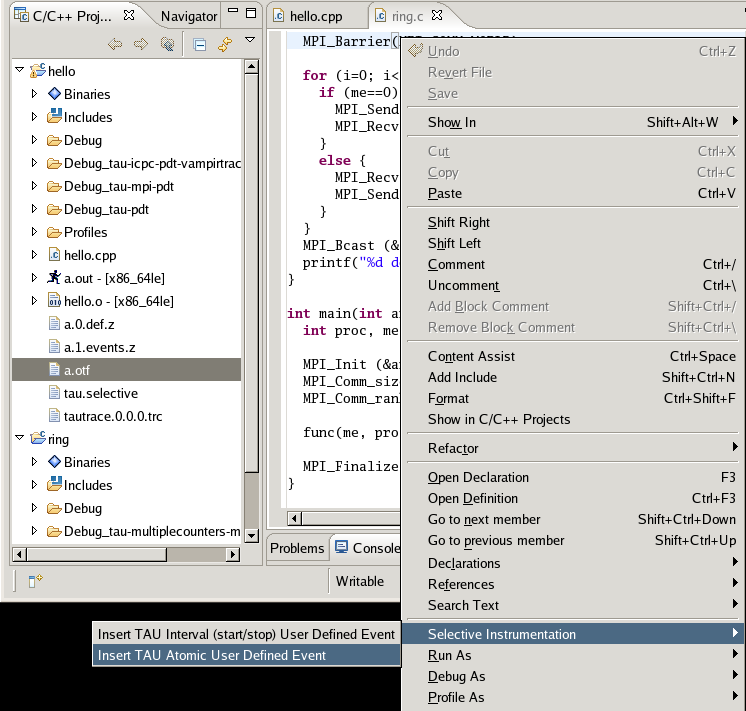
The source editor’s context menu allows the insertion of interval and atomic user defined events. To specify an atomic user defined event, place the cursor on the line where you want the event to trigger, right click, go to the Selective Instrumentation sub-menu and select Insert TAU Atomic User Defined Event. Put the name you wish to associate with the event in the first context window that appears. Put either a numeric constant or the name of a valid numeric variable in the second window.
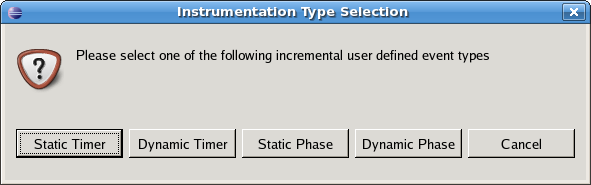
To specify an interval based user defined event, select the source code you wish to be included in the interval, right click, go to the Selective Instrumentation sub-menu and select Insert TAU Interval (start/stop) User Defined Event. You may select use of a Static Timer, Dynamic Timer, Static Phase or Dynamic Phase event. Note that to get phase data you must select a TAU makefile configured with the -PROFILEPHASE option. Once you have selected the event type you will be prompted to enter a name for the event.
All selective instrumentation options are placed in the tau.selective file in your project’s main directory. This file is automatically employed when the TAU launch configuration has "internal" selective instrumentation selected. You may safely edit this file manually so long as it remains a valid TAU selective instrumentation file.
Launching a Program and Collecting Data
To launch your project with TAU either select the Profile button from the profile launch configuration window, select your launch configuration from the dropdown menu of the profile button or, if your desired configuration is already selected, simply click on the profile button.
If a perfdmf database is configured and available, TAU profile data will be saved there. Trace data and other performance data output will be stored in your project’s top level directory. If a perfdmf database is not available or you have selected to save profile data on the file system profile output will appear in a Profiles directory in your project’s top level directory. Profiles are organized in sub-directories by the TAU configuration options used to generate them and the time-stamp of their creation.